CEO’S Corner: Findings from the 2023 Annual Survey
By Marisa James, Chief Executive Officer, and Elizabeth Swartz, IT Manager
Each fall, the NAACLS Annual Survey of Programs is sent to all Program Directors of NAACLS accredited programs, serving as a vital tool for maintaining our high accreditation standards. Submission of the completed survey is required annually according to NAACLS accreditation standards. Last year, we introduced several new questions, and we appreciate your patience and efforts in answering them. We are excited to share fresh observations and hope you find the data valuable.
As the laboratory workforce shortage intensifies, sharing key insights with the community becomes more critical than ever. This includes the number of NAACLS accredited programs and graduates, certification examination pass rates, graduation rates, and job placement rates. Additionally, we are tracking trends in program resources, program director turnover, and the growing number of programs pursuing initial accreditation. This year, we have introduced new data on applicants and vacancies by discipline, offering a deeper look into the state of the laboratory field. This new data is a significant addition to the survey, providing a more comprehensive understanding of the current state of the field. Once all the data is shared, I will reflect on significant discoveries and highlight steps NAACLS has taken over the past year to address the laboratory workforce shortage. Finally, I will outline our vision for using this data to drive future NAACLS Annual Surveys of Programs and guide prospective initiatives.
It should be worth noting that Doctorate in Clinical Laboratory Science (DCLS) Programs are omitted from most of the data shared in this article. This is due to the low number of DCLS programs, which makes maintaining confidentiality difficult.
Accredited Program Data
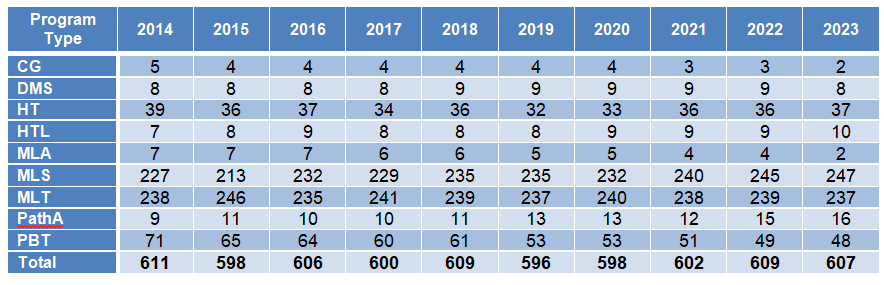
In 2023, 607 programs received the NAACLS Annual Survey and self-reported their data. Ten-year longitudinal data for the number of programs by program type appear in Table 1. Please note: Medical Laboratory Assistant (MLA) and Phlebotomy (PBT) Programs became accredited in 2022; therefore, the data below includes both accredited and approved statuses. The total number of programs has remained relatively consistent, with 611 programs in 2014 and 607 in 2023. Regarding percentage growth, the most concentrated areas of expansion are seen in Pathology Assistant (Path A) Programs, with a 77% increase from 2014-2023, and Medical Laboratory Scientist (MLS) Programs increasing nearly 9% over the decade. The number of Medical Laboratory Technician (MLT) Programs, Diagnostic Molecular Science (DMS), Medical Laboratory Assistant (MLA), Histotechnician (HT), and Histotechnologist (HTL) Programs are essentially stable. The number of Cytogenetic (CG), Phlebotomy (PBT), and Medical Laboratory Assistant Programs decreased during the ten-year span.
Table 1. NAACLS accredited programs by type from 2014-2023
Figures 1 and 2 below display a 15-year look back with trend lines for the various programs. Figure 1 provides information on what type of institution each Program is based in.
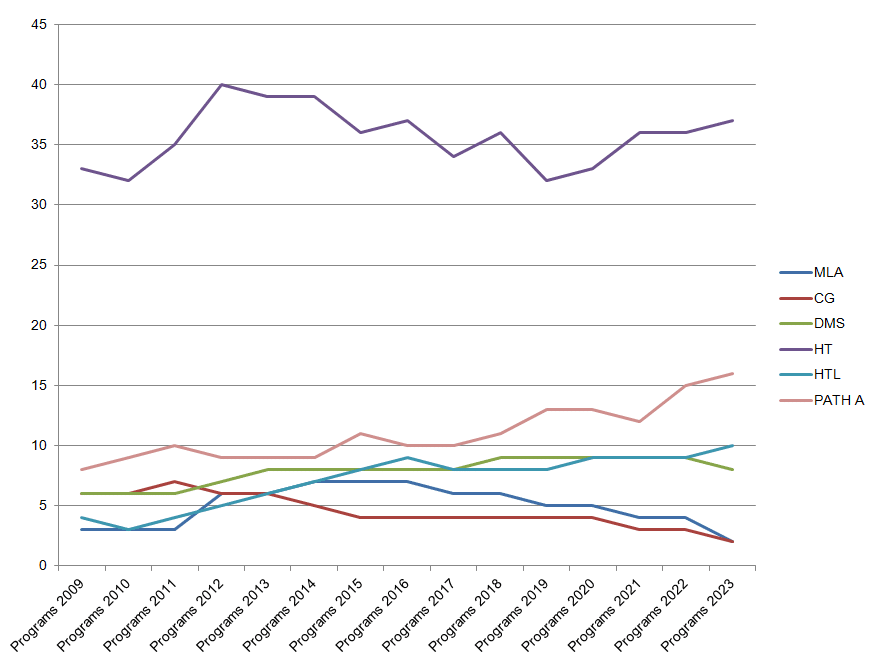
Figure 1. NAACLS program numbers 2009-2023
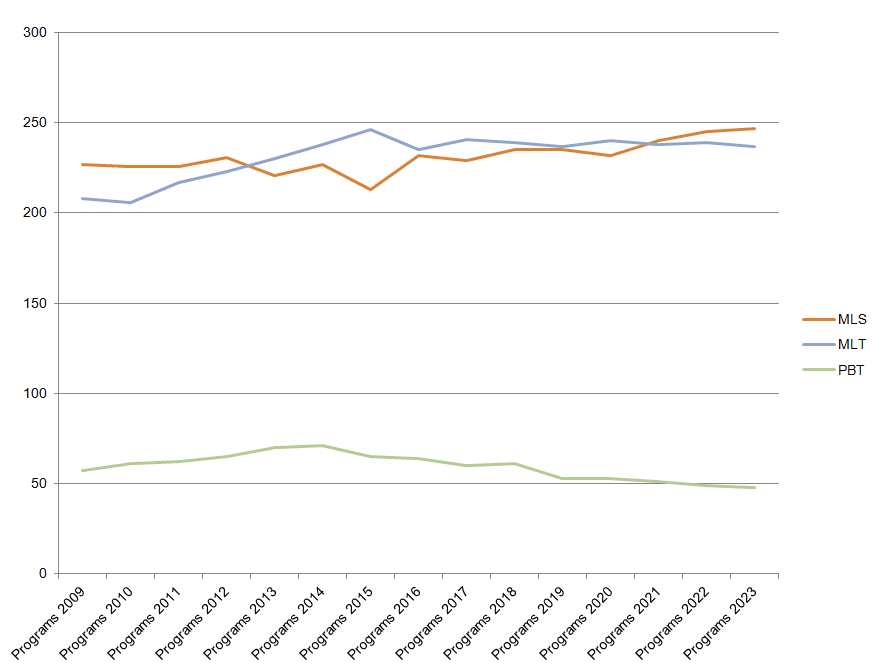
Figure 2. NAACLS program numbers 2009-2023
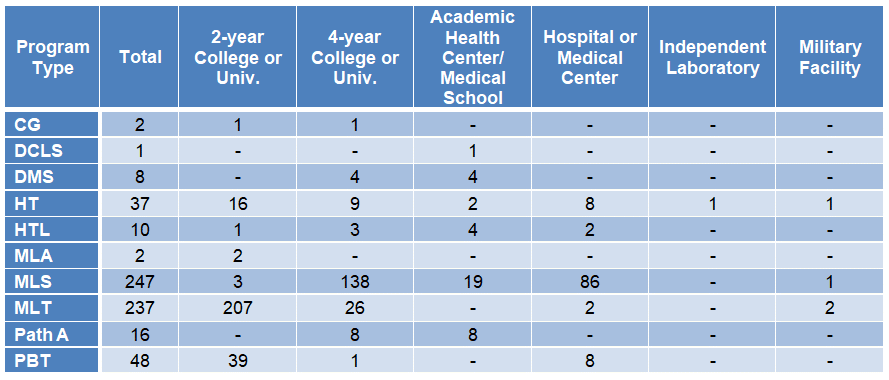
The pie chart in Figure 3 below displays the institutional breakdown of programs in 2024. We used the information to break down the information by discipline as well, which can be seen Table 2.
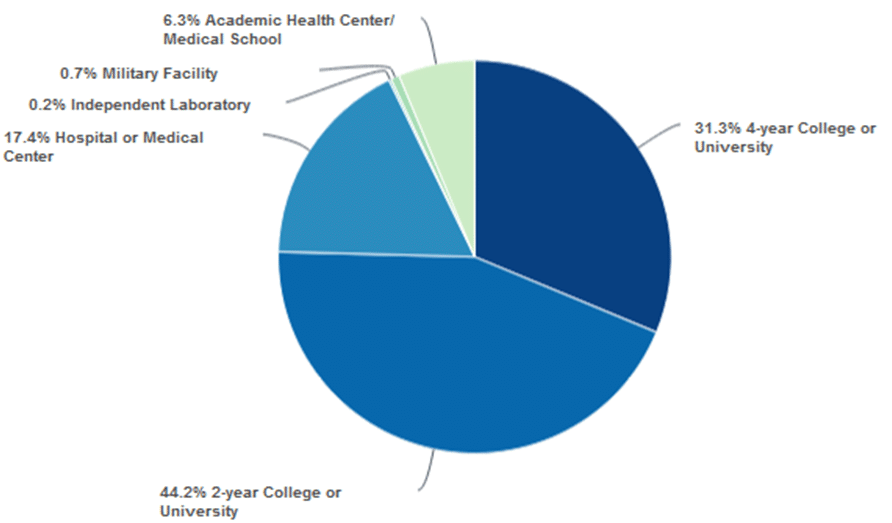
Figure 3. Institutional breakdown of programs
Table 2. Institutional breakdown of programs by discipline
Initial Accreditation and Serious Applicant Status
Between September 1, 2023, and April 1, 2024, NAACLS received 10 applications from programs seeking NAACLS Initial Accreditation from the various pathways. Fourteen additional programs reached Serious Applicant Status. These fourteen programs are eligible to have their students sit for the exam via the NAACLS route after completing the program. Figures 4 and 5 depict the various disciplines.
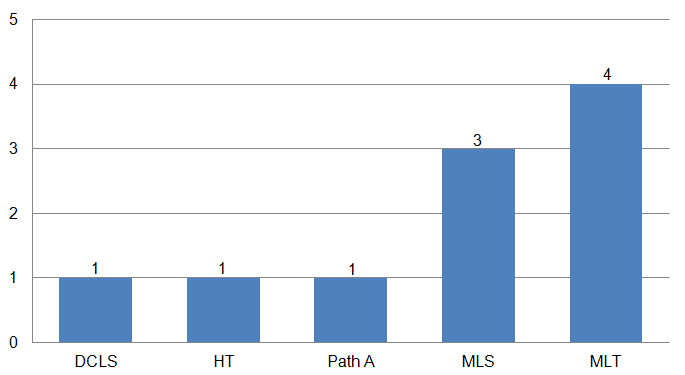
Figure 4. Initial Programs seeking accreditation
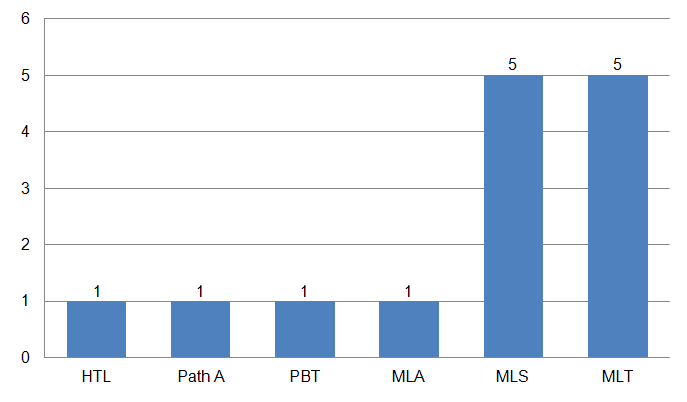
Figure 5. Programs achieving serious applicant status
Number of Program Graduates
Fifteen-year longitudinal data for the numbers of program graduates by program type appear in Table 3 (click on chart to enlarge) and Figures 6 and 7. The most notable increase in graduates comes from the MLS discipline. The rise in MLS graduates is striking at a nearly 54% increase. This trend is interesting as data also reflects only modest gains in the number of programs, which implies program officials are developing innovative approaches to expand the capacity of students. Certainly, the various modes of education delivery have been a factor, as well as possible administrative pressure on program officials to increase enrollment, implement more effective student recruitment strategies, and develop novel ways to supplement and enhance clinical experiences. All other disciplines have remained steady in producing the number of graduates, providing reassurance about the overall stability of these programs.
Table 3. NAACLS Program graduates by year from 2009-2023
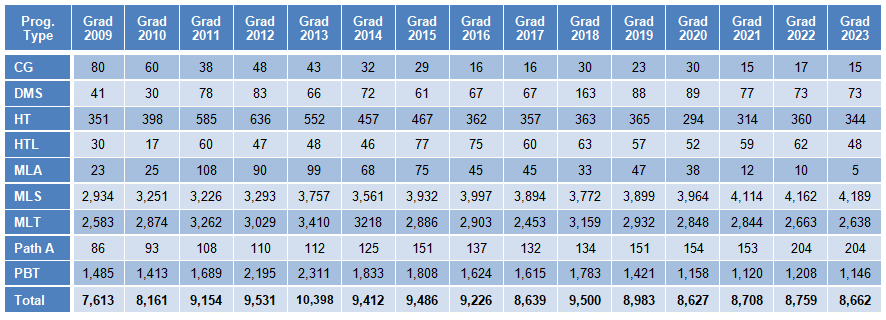
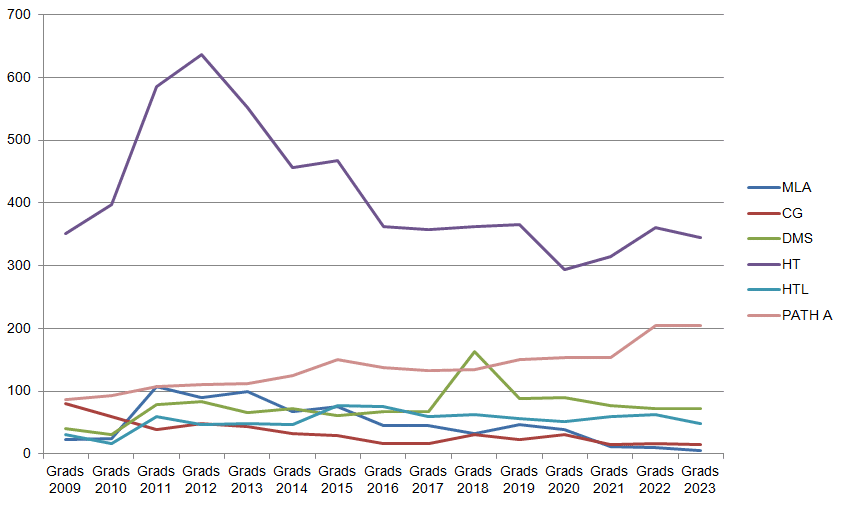
Figure 6. NAACLS Program graduates
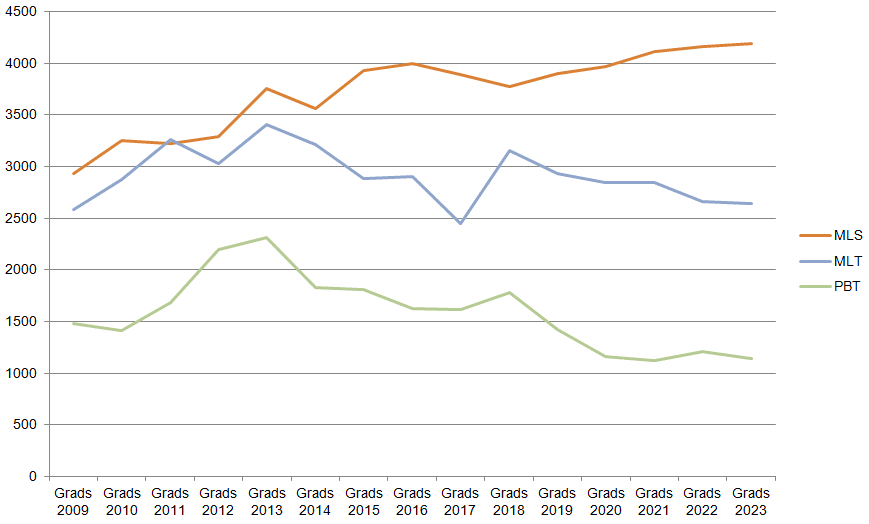
Figure 7. NAACLS Program graduates
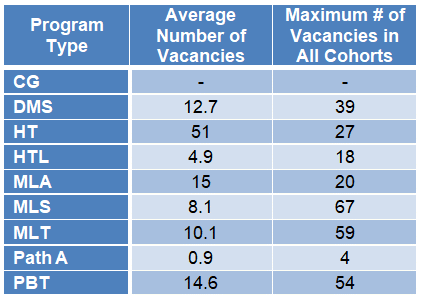
In Table 4 below, a new dataset we collected contains data on the number of applicants, capacity, enrolled students, graduates, and vacancies for each pathway. For many program types (CG, MLS, Path A, and PBT), the data indicates the total number of applicants exceeds the total capacity in a program. While the data does not reflect on the quality of applicants, it suggests a growing societal awareness of those laboratory professions. Conversely, programs such as DMS, HT/HTL, MLA, and MLT have fewer applicants than capacity, which indicates a need for more targeted outreach or recruitment efforts. Table 5 looks at the average number of vacancies in each discipline as well as the maximum number of vacancies reported.
Table 4. New NAACLS data
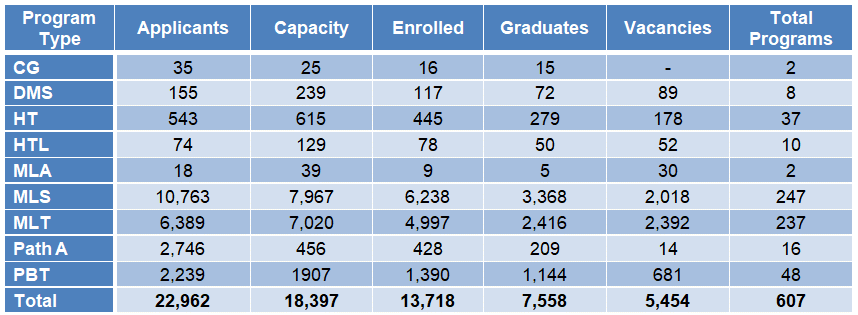
Table 5. New NAACLS data for Program average number of vacancies and the maximum number of vacancies
Program Expansion Barriers
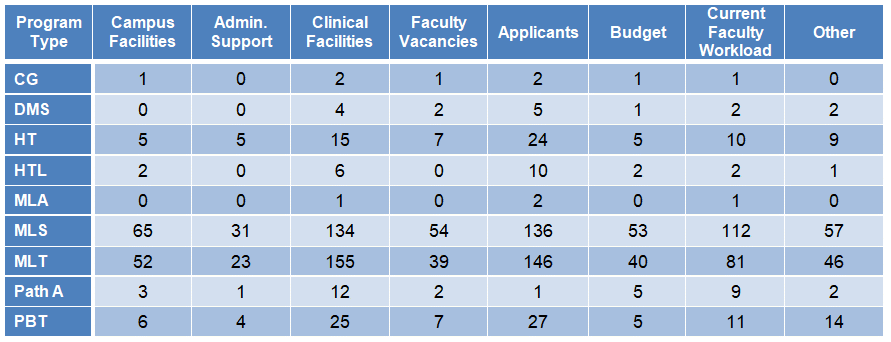
In studying Figure 8, the most significant barriers to program expansion are the number of student applicants and clinical facilities. However, there are many program vacancies, and filling those open slots in all programs could help alleviate the workforce shortage. We broke down this question by discipline in Table 6; the data mirrors the whole laboratory profession. A significant number of responses were also in the ‘Other’ category. Based on the comments, we will add more options to the Fall 2024 survey, such as laboratory staffing levels, number of qualified student applicants, lack of marketing, and competition from other laboratory programs to help add more to the story.
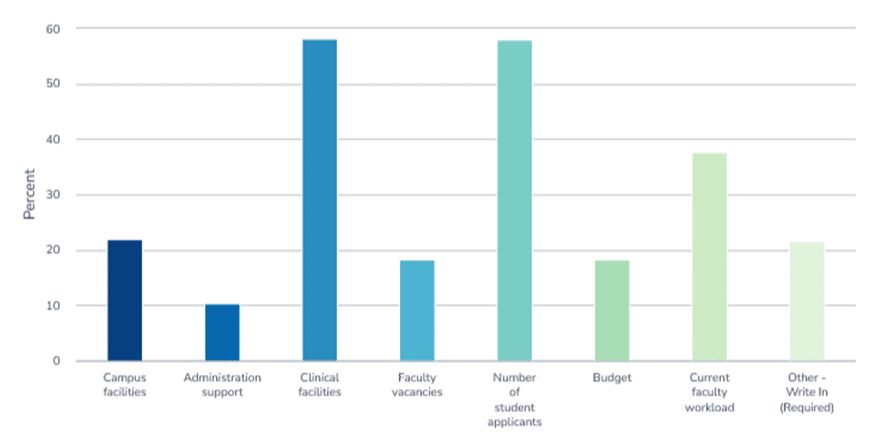
Figure 8. NAACLS Program expansion barriers
Table 6. NAACLS Program expansion barriers by discipline
Benchmarks
NAACLS proudly boasts an outcomes-based approach to accreditation. We have 3 major benchmarks we collect annually each fall from our Programs:
- Certification exam pass rates – 3-year rolling average of 75% pass rate on accepted certification examinations taken within the first year after graduation.
- Graduate placement rates – 3-year rolling average of 70% finding employment or continuing education within one year of graduation.
- Graduation rates – 3-year rolling average of 70% graduation rate for students who have begun the final half of the program.
In the past 3 years, 20,377 students sat for the ASCP Board of Certification exams, and 320 individuals sat for the AMT exams. Table 7 represents a 3-year retrospective data of program average percentage rates for the 3 benchmarked outcomes. Percentages are stable through the 3 years of 2020-2022.
Table 7. Average of outcomes by program type
Note: Highlighted numbers fall below the benchmarks.
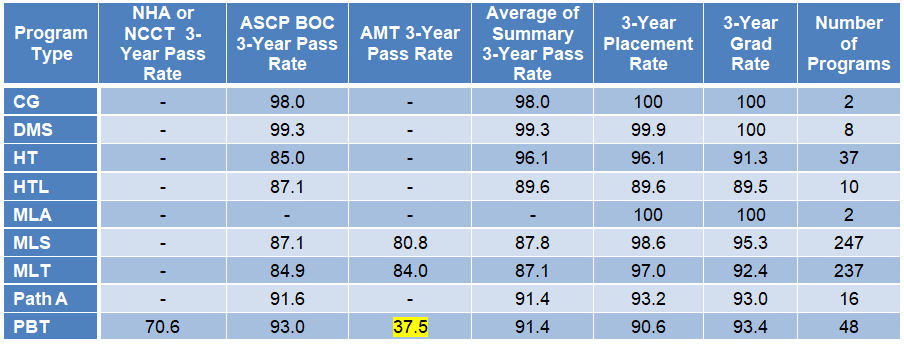
Table 8. 2023 Survey outcomes average

Figure 9 shows a 5-year retrospective of the number of Programs that failed to meet the benchmarks. NAACLS does not cite Programs that are below our established benchmarks. We request an Action Plan, which is due approximately two months after the Annual Survey of Programs is closed. The data below suggests an increase in the number of Action Plans. In particular, certification pass rates pose the greatest challenge. At the same time, most students successfully graduate from programs and find relevant employment or continue with additional education, which is a testament to the overall effectiveness of our programs.
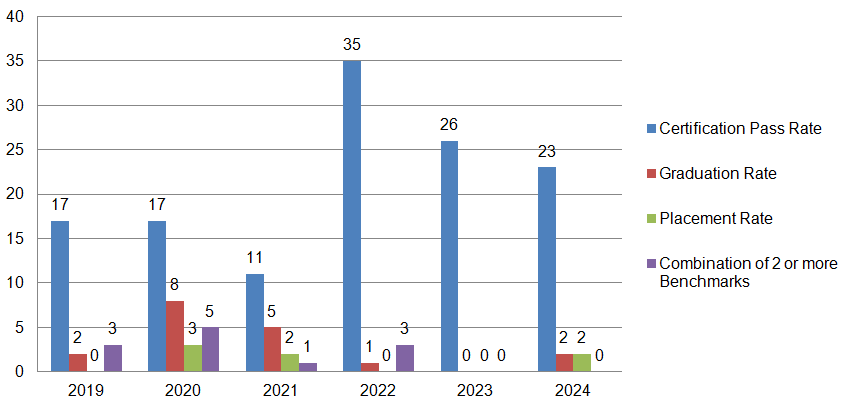
Figure 9. NAACLS Action Plan data from 2019-2024
Changes in Program Resources
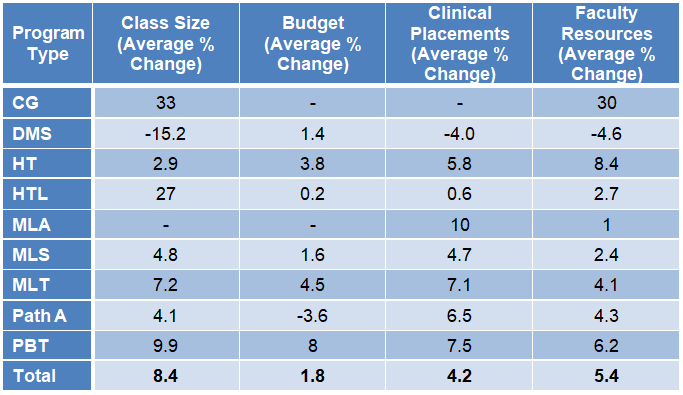
NAACLS collects data on relative changes in program class sizes, budgets, clinical placements, and faculty resources. In the Annual Survey of Programs, programs reported changes from year to year for these characteristics, which NAACLS monitors annually for trends (Table 9). The data suggests an increased class size, whereas budgets, clinical placements, and faculty resources decreased from 1 year ago and are more in line with the number from 2 years ago. We broke down the program’s reported changes by discipline, as reflected in Table 10.
Table 9. Programs’ reported changes 2020-2023
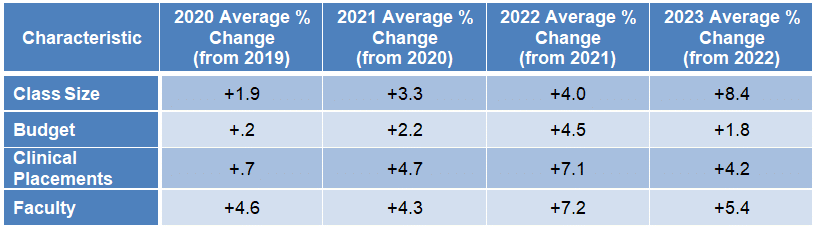
Table 10. Programs’ reported changes by discipline, 2023 data
While the number of new program directors remains high, the number may have peaked in 2023. Figure 10 shows the turnover of Program Directors in the past eight years. Anecdotal evidence suggests this is partially due to program faculty retiring from long-held positions. High turnover increases the workload of NAACLS volunteers, including Self-Study Reviewers, Site Visitors, Review Committee members, and new Program Director mentors as the new Program Directors become acclimated to these positions. NAACLS Staff and volunteers must continue to diligently provide continuing education offerings to support new program officials.
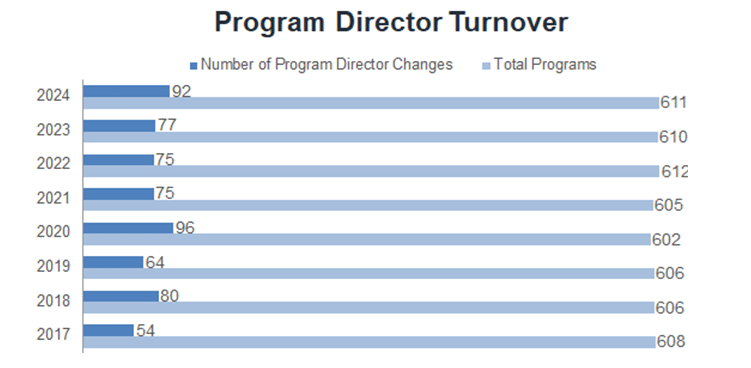
Figure 10. Program Director turnover
Program Nomenclature
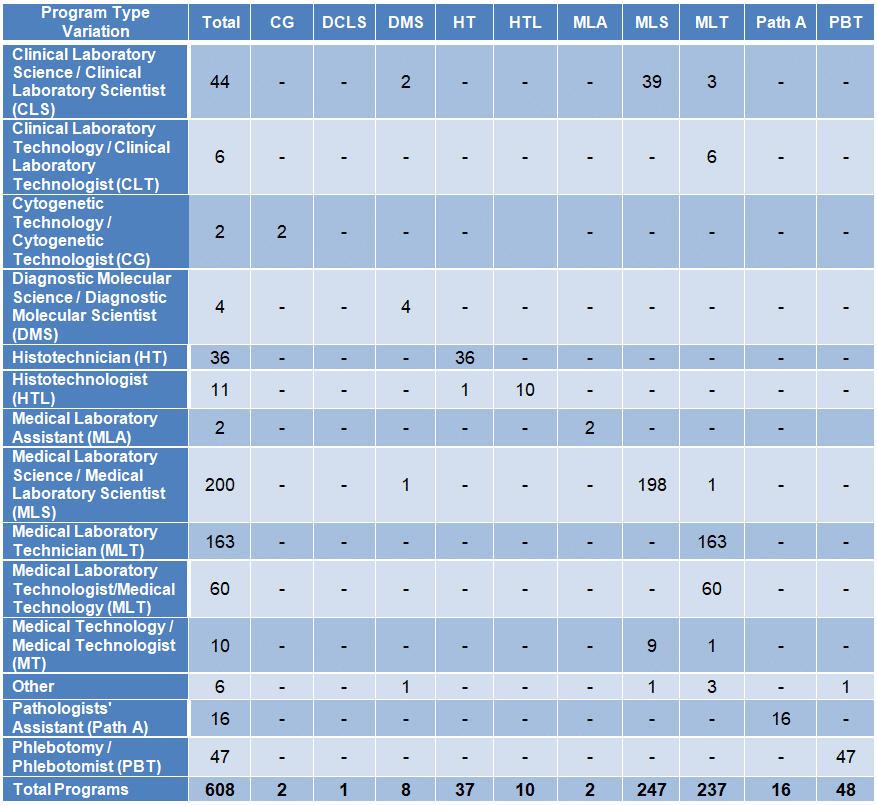
In 2021, the NAACLS Board of Directors voted to support a white paper entitled “Standardizing the Professional Title of Medical Laboratory Professionals.” This document is a position paper created by the American Society for Clinical Laboratory Sciences (ASCLS) and the American Society for Clinical Pathology Board of Certification (ASCP BOC). NAACLS collected data to determine how many programs are named the same as their accreditation pathway. The data indicates most Medical Laboratory Scientist Programs (nearly 200) use the MLS name. Approximately forty programs are named Clinical Laboratory Science, and less than ten are named Medical Technology. According to the survey, Medical Laboratory Technician Programs include several iterations of Program names. It is clear from the data that there is still work to be done to standardize program names with the relevant accreditation pathway.
Resource: https://ascls.org/standardizing-the-professional-title-of-medical-laboratory-professionals/
Table 11. Program name variations for program types
New insights
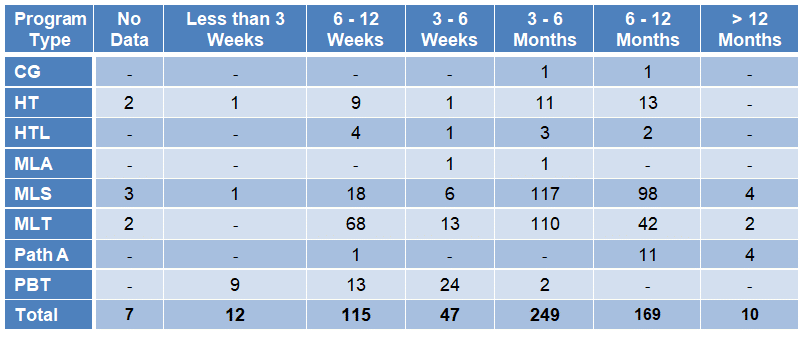
On the 2023 NAACLS Annual Survey of Programs, we introduced a few new questions that we believe will enhance our understanding of the NAACLS community. These questions, which we hope you find insightful, were designed to reveal trends in the program discipline as well across all disciplines. We are excited about the potential benefits these new Tables and Figures could bring to our community. We know many programs offer part-time options for students, and you can see the percentage in Table 12. Additionally, we hope programs find it beneficial to see how other programs break down their students’ clinical rotations. Due to data entry errors, Table 13 does not include all 607 programs but provides enough information to glean trends. We noticed many programs answered ‘Other’, so we will add more options to the 2024 Survey including Clinic Laboratory, Forensic or Coroner’s Laboratory, and State Laboratory. The length of Clinical rotations in NAACLS programs overall and by discipline are shared in Table 14 and Figure 11.
Table 12. Average percentage of part time students per program 2022-2023
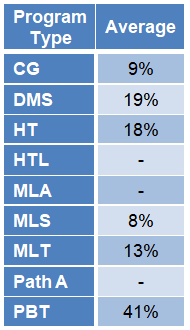
Table 13. Average estimated percentage of time in clinical rotation
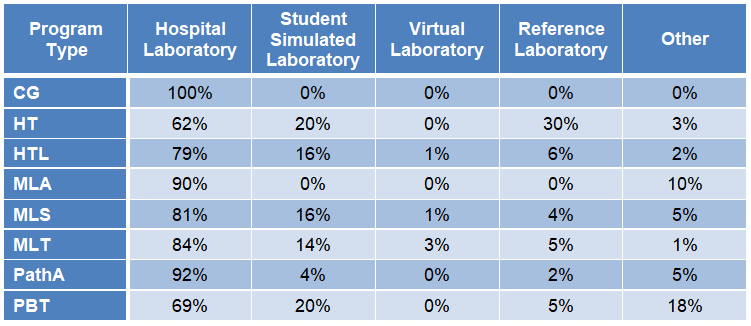
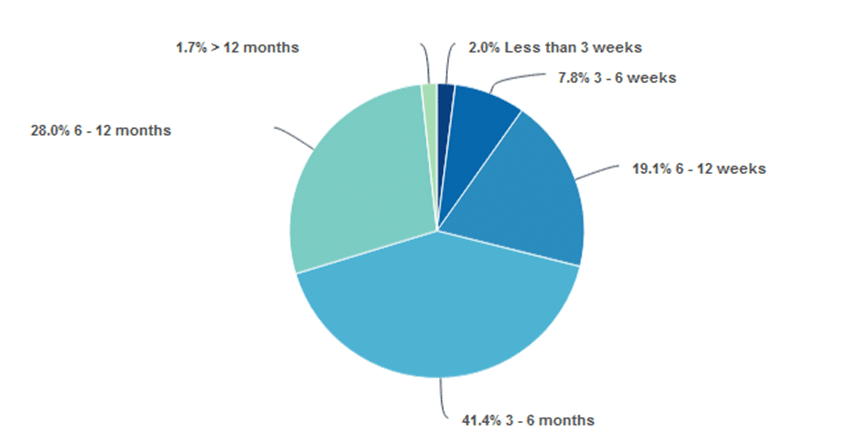
Figure 11. Length of time students spend time in a hospital laboratory for their clinical rotation
Table 14. Length of time students spend time in a hospital laboratory for their clinical rotation by discipline
Reflections from the CEO
The percentages of NAACLS accredited programs that have successfully met benchmarked outcomes, including certification pass rates, graduation, and placement rates, have been stable over three years. Comparing the numbers of program graduates (Table 3) with trends in program resources (Table 9) suggests a significant increase in program production of graduates without the benefit of substantial increases in resources.
Additionally, the number of newly approved program directors within the last year reflects a notable turnover in program directors of continuing programs. The number of new Program Directors creates challenges for NAACLS’ volunteers and Staff to assist these new directors as they adjust to their new responsibilities. NAACLS must also provide continuing education opportunities for these individuals and other program officials.
The 2022 NAACLS Annual Survey of Programs data reveal modest increases in accredited programs and graduates of most program types over the past decade. The increases are more significant for some program types, such as Medical Laboratory Scientist Programs. This data opposes a popular yet incorrect narrative that MLS programs are decreasing. While the number of MLS Programs is undoubtedly different from what it was in the 1980s or 1990s, the steady number over the past fifteen years is encouraging. This trend should be highlighted when recruiting individuals to the field. Regardless of the laboratory discipline, potential students do not want to discover program numbers have decreased, nor is that a good strategy for securing additional program resources from the administration, C suite, or government entities. The laboratory profession is the lynchpin in healthcare, and laboratory professionals need to showcase the brilliant minds behind the scenes to the community, students, administrators, and key decision makers.
The additional data visualizations we gathered from programs highlight our programs’ innovation. NAACLS’ flexible standards allow for programs to set up their education according to how it works best in their institution and with the resources they have.
NAACLS 2024 Annual Survey Preview
Please note: All Program Officials were sent a list of the NAACLS 2024 Annual Survey last week.
The NAACLS 2023 Annual Survey of Programs included many new questions, some of which were provided earlier in this article. For the 2024 Annual Survey of Programs, we are actively working on updating the questions to ensure they are more straightforward to answer. NAACLS Staff reviewed survey comments to gather ideas for adjusting these questions. The following new questions were included, and data visualizations were provided:
- Number of student applicants per cohort
- The capacity of students in programs
- Number of vacancies in programs
- The average percentage of part-time students per program
- Length of hospital and/or simulated clinical rotations
- Identifying the rate-limiting steps to increasing student capacity in programs
Regrettably, due to the variety of answers and qualifiers given in the survey, NAACLS Staff was not able to ascertain usable data for the following questions:
- The average percent of the programs that offer weekend, evening, online, or asynchronous options
- Full-time Equivalent (FTE) faculty/instructor ratio in the student laboratory, simulated laboratory clinical laboratory, or lecture component
- Distribution of faculty and instructor responsibilities (for example, clinical, research, or responsibilities for other programs)
Over the past year, NAACLS has done its best to provide programs and other laboratory stakeholders with more data visualizations using information collected from the NAACLS Annual Survey of Programs. Through the Summit of the Workforce Action Alliance (WAA), weset a goal to “Strengthen the data to understand the laboratory workforce.” https://www.cola.org/workforce-action-alliance/ While some of the data we collected on the 2023 Annual Survey of Programs was not discernible, we are actively working to improve how we can ask questions to ascertain the information we desire from our programs. The data gleaned from the NAACLS Annual Survey of Programs can be used to help secure resources for the laboratory science field because this strategy works in other healthcare sectors (i.e., Nursing). Providing data to prove a workforce shortage, faculty or preceptor shortage, or other resource gaps may allow programs to obtain financial assistance from the government.
Conclusion and the next steps for the NAACLS Annual Survey of Programs
We are disappointed our efforts to obtain data allowing our programs to compare their faculty resources to other programs were unsuccessful. We had hoped this would lead to the ability of program directors to set internal benchmarks for faculty workload, student/instructor ratios, etc. without prescription in our standards. However, NAACLS remains steadfast in our commitment to assisting programs with data and will continue to request information that may be helpful to our programs. This may be in the form of improving questions on the existing NAACLS Annual Survey of Programs or by sending out targeted e-mails. For instance, we recently sent a Voluntary Withdrawal Survey to program officials from programs that have closed in the past three years to look for trends in why programs opted to close. We hope to share what we found in next year’s CEO Annual Survey article.
We hope you found the information shared in this article helpful. We will continue to gather data from our programs to help identify trends in laboratory education and help unlock new resources to support you and your program. We believe the information ascertained in the NAACLS Annual Survey of Programs will provide a pathway toward securing added resources for our accredited programs.
Disclaimer – This published information was developed from a survey of information submitted to NAACLS by NAACLS-accredited programs. The published information contains only historical information and does not contain any projected information. NAACLS has not verified the accuracy, completeness, or suitability of any published information, and it does not recommend, encourage or endorse any use of the published information. NAACLS makes no warranty, guarantee or representation whatsoever, and assumes no liability or responsibility in connection with, the use or misuse of this published
Editor’s Note: NAACLS Staff is working on the final details of the 2024 Annual Survey of Programs . A draft version of the survey is available here