CEO’S Corner: Findings from the 2024 Annual Survey
By Marisa James, Chief Executive Officer, and Elizabeth Swartz, IT Manager
Every fall, NAACLS distributes its Annual Survey of Programs to all program directors of NAACLS-accredited programs. This survey is an essential component of upholding our accreditation standards, and its completion is required for accreditation.
Over the past several years, the survey’s scope has expanded to capture data that reflects evolving trends and emerging needs within the laboratory community, helping support and grow your programs. In addition to program outcomes, we now track flexible learning formats such as evening, weekend, online, and asynchronous offerings, as well as shifts in program resources. This year’s survey also includes insights into applicant pools with student vacancies across disciplines, offering a more detailed picture of the workforce landscape. These additions enrich our understanding of the field and strengthen our ability to respond to workforce challenges.
Please note that Doctorate in Clinical Laboratory Science (DCLS) programs are excluded from most of the data presented in this article due to their limited number, which poses challenges in maintaining confidentiality.
Accredited Program Data
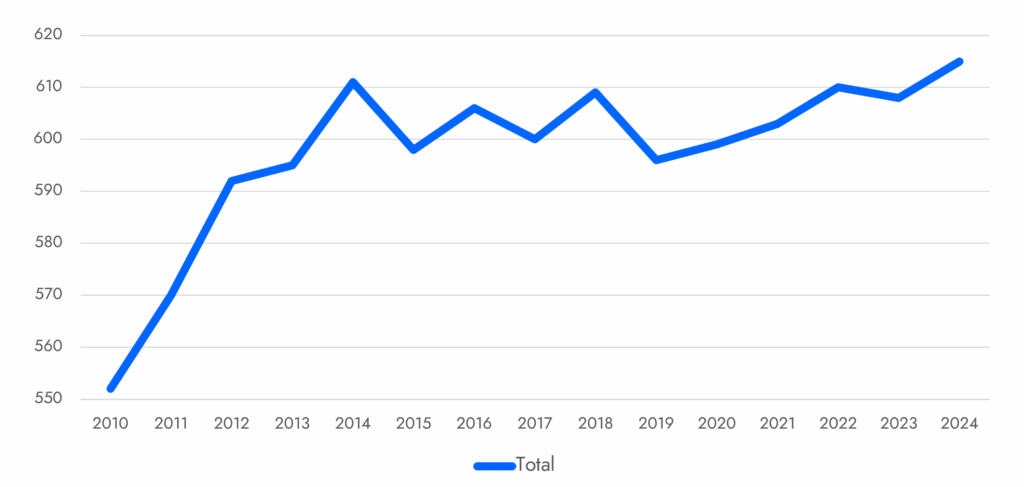
In 2024, 614 programs received the NAACLS Annual Survey and self-reported their data. As shown in Figure 1, the total number of programs has followed a positive trend over the past fifteen years, increasing from 552 in 2010 to 614 in 2024. This upward trajectory, the highest number of programs NAACLS has accredited since 1999, is a reason for optimism. Emphasizing this growth when recruiting individuals to the field is a strategy worth pursuing. Across all laboratory disciplines, prospective students (and their parents or loved ones) may be encouraged by this positive trend. For your own programs, this continued growth can help build confidence among your administration, C-suite, or government entities when requesting additional program resources and support.
Figure 1. NAACLS Total Program Numbers 2010-2024
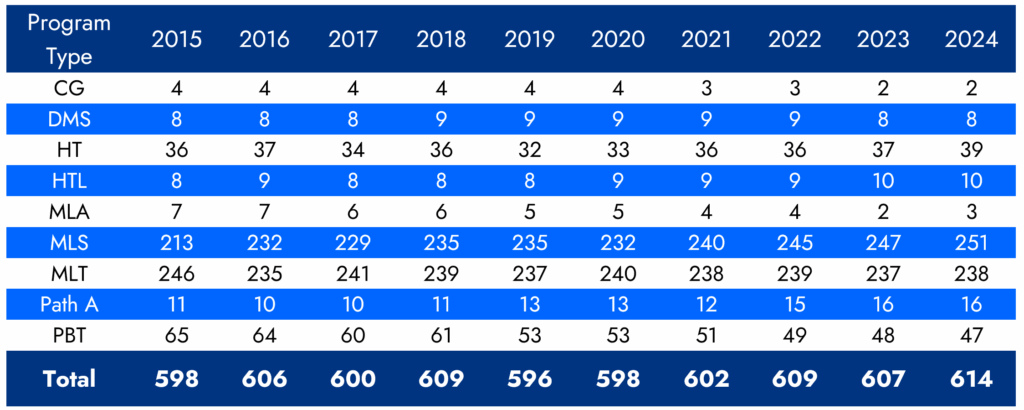
Ten-year longitudinal data on the number of programs by disciplines are presented in Table 1 Please note that Medical Laboratory Assistant (MLA) and Phlebotomy (PBT) Programs were first accredited in 2022; the data includes both accredited and approved statuses.
The program discipline that experienced the most growth was Pathology Assistant (Path A), with increased by 45% from 2015 to 2024. Medical Laboratory Scientist (MLS) Programs also grew substantially, with nearly an 18% increase over the same period. In contrast, the number of Medical Laboratory Technician (MLT), Diagnostic Molecular Science (DMS), Histotechnician (HT), and Histotechnologist (HTL) Programs remained relatively stable. Meanwhile, the number of Cytogenetic (CG) and Medical Laboratory Assistant (MLA) Programs declined by about half over the decade, and Phlebotomy (PBT) Programs decreased by nearly 28%.
Table 1. NAACLS Accredited Programs by Type From 2015-2024
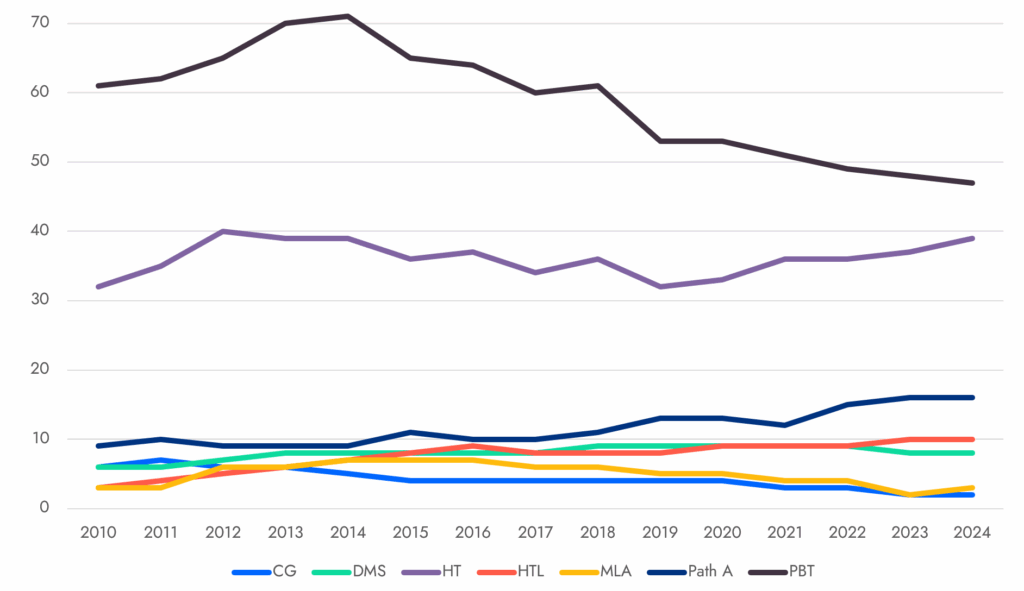
Figures 2 and 3 below present a 15-year overview with trend lines for the various program types, while Figure 4 illustrates the distribution of programs by institutional type
Figure 2. NAACLS MLS and MLT Program Numbers 2010-2024
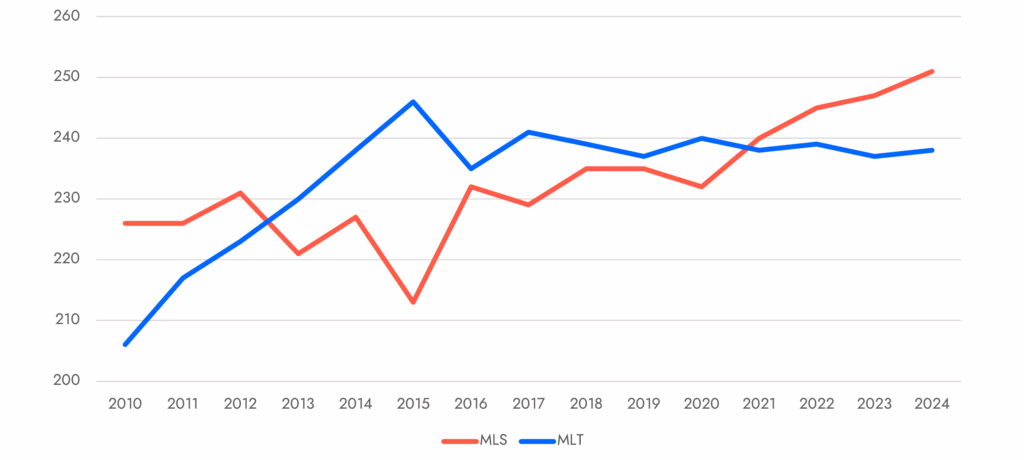
Figure 3. NAACLS Program Numbers by Discipline (Excluding MLS And MLT) 2010-2024
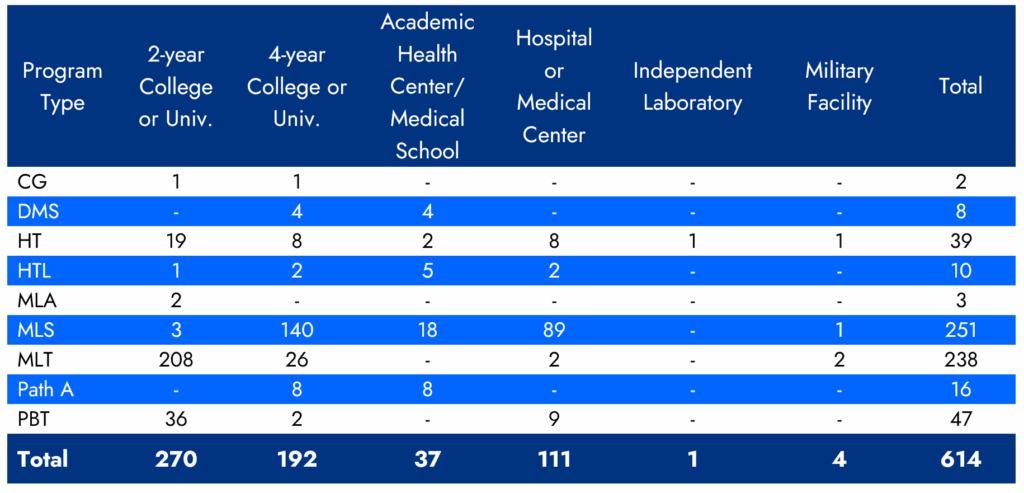
Thepie chart in Figure 4 shows the institutional distribution of programs in 2024. This information was further analyzed by discipline, as presented in Table 2.
Figure 4. Institutional Breakdown of Programs – 2024
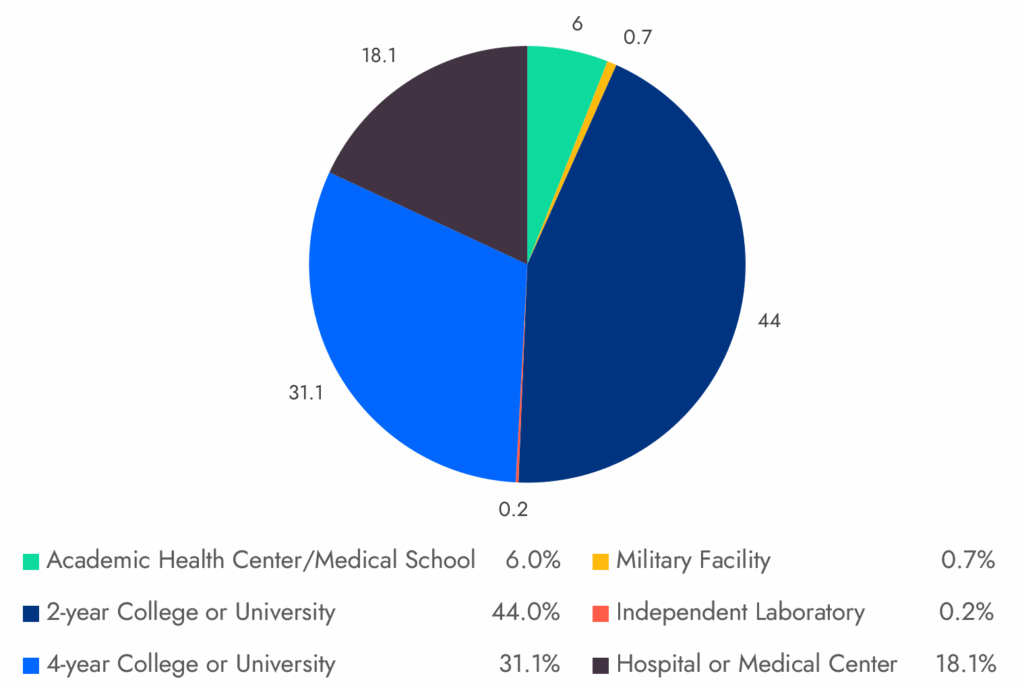
Table 2. Institutional Breakdown of Programs by Discipline – 2024
Initial Accreditation and Serious Applicant Status
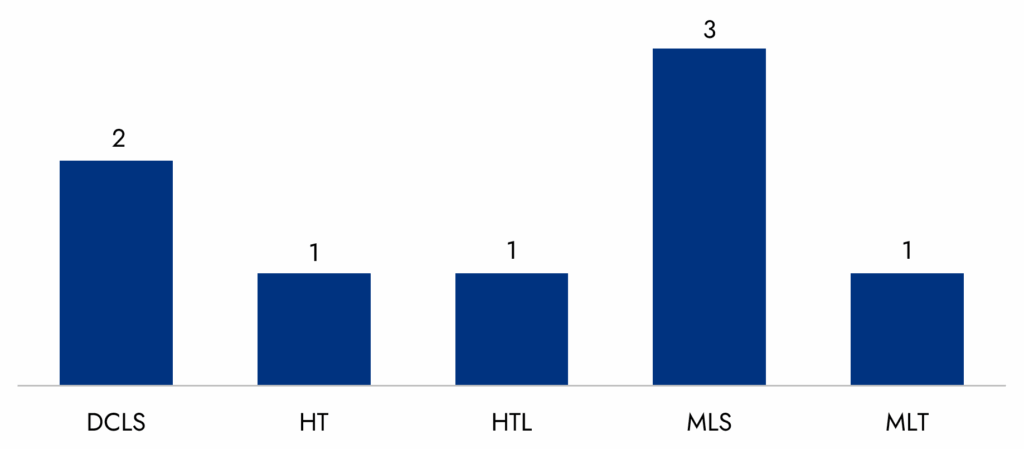
As of September 1, 2025, a total of 33 programs are in the Initial Accreditation Process. Figure 5 below highlights seven programs pursuing NAACLS accreditation that have completed the Accreditation Application Packet since April 2025. Figure 6 presents the eight programs that have achieved Serious Applicant Status/Candidacy Status. These programs are now eligible for their students to sit for certification examinations via the NAACLS route while continuing through the accreditation process. Additionally, two Doctorate in Clinical Laboratory Science (DCLS) Programs remains in Candidacy Status.
Figure 5. Initial Programs Seeking Accreditation – April 2025 to the Present
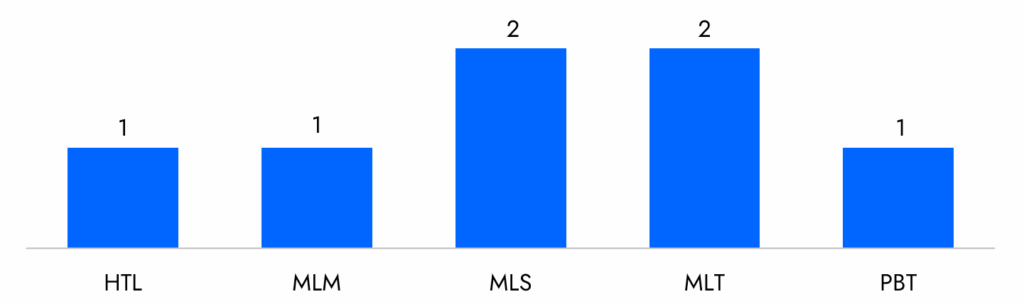
Figure 6. Programs Achieving Serious Applicant Status/DCLS Candidacy Status
Number of Program Graduates
Table 3 and Figures 7 and 8 present fifteen years of longitudinal data on program graduates by discipline. Interestingly, while the number of DMS programs has not increased, the graduates has more than doubled. Similarly, Pathology Assistant graduates have more than doubled, reflecting the growth in program numbers. MLS graduates have increased by 30% over the same period, indicating steady program expansion. In contrast, the number of MLT programs remained relatively stable, as has the number of graduates. The remaining disciplines have produced consistent graduate numbers, underscoring the overall stability of these programs.
Table 3. NAACLS Program Graduates by Year From 2010-2024
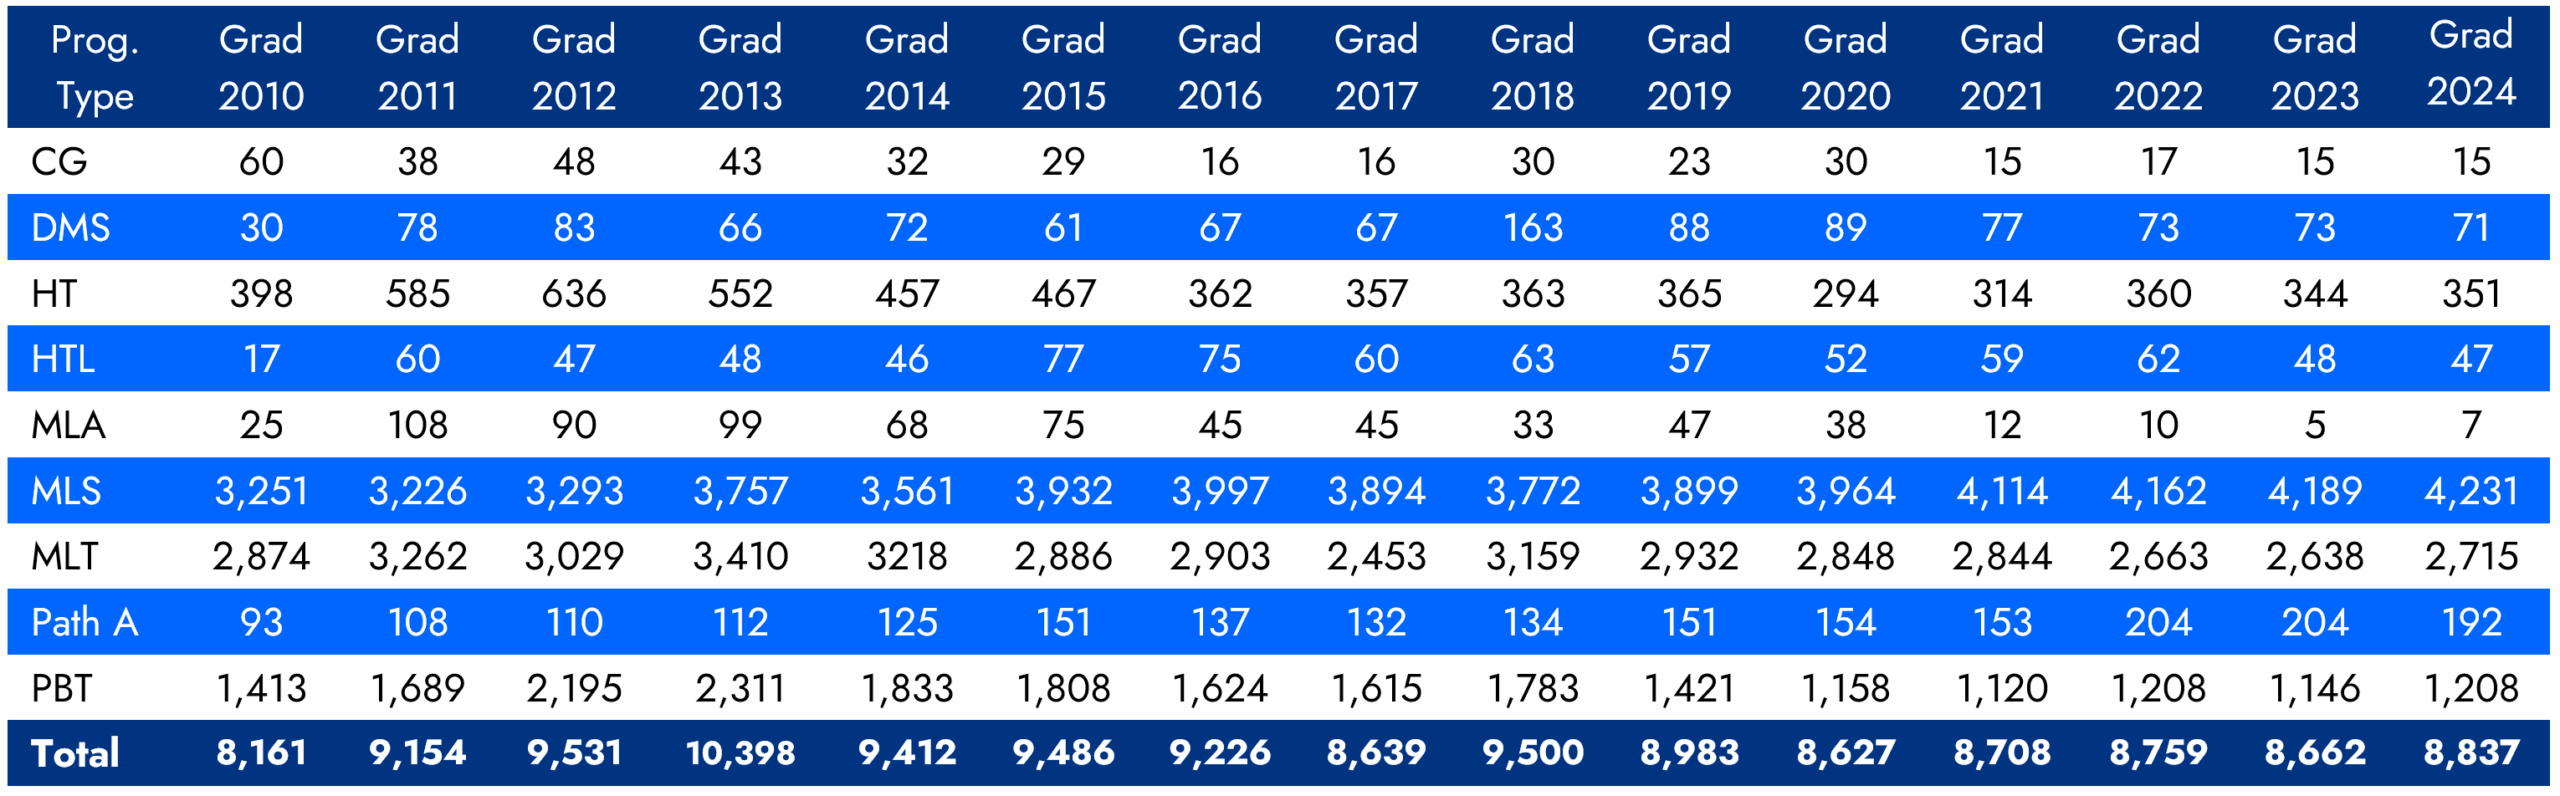
Figure 7. NAACLS Program Graduates
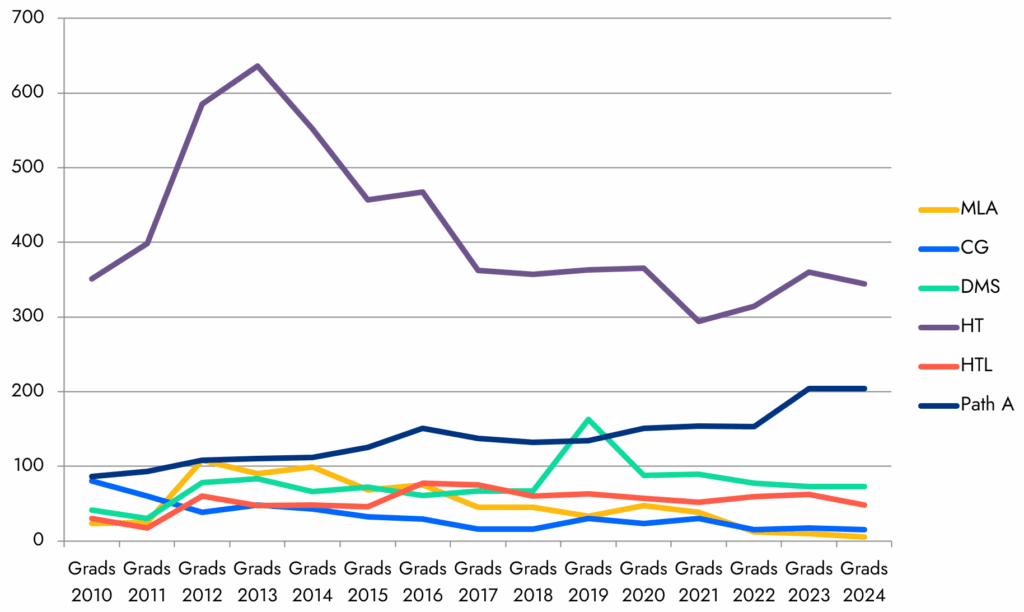
Figure 8. NAACLS Program Graduates
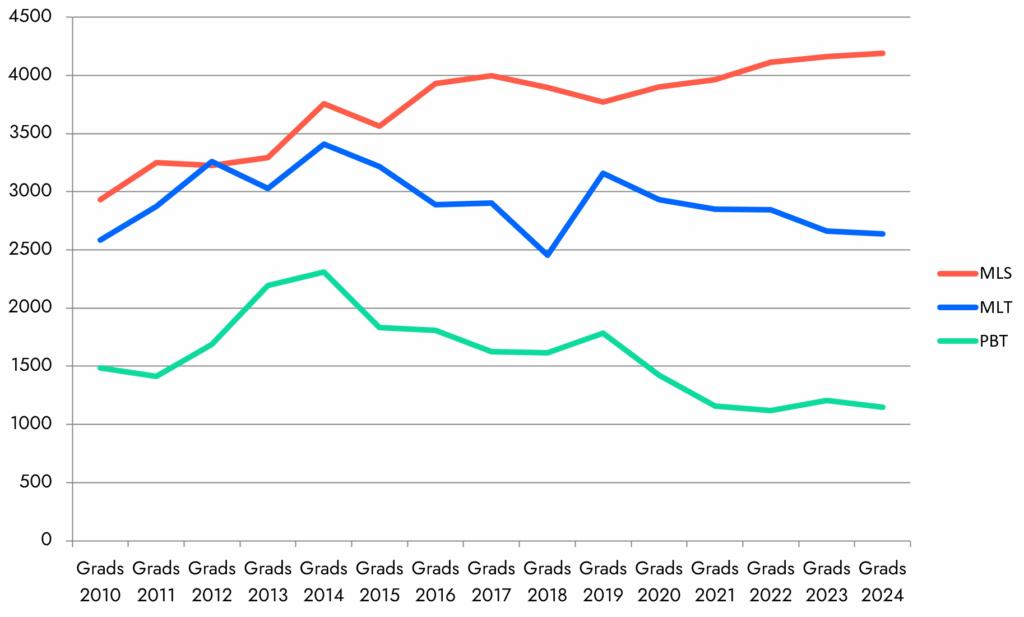
Table 4 presents a dataset that captures the number of applicants, program capacity, enrolled students, graduates, and vacancies for each pathway. This data is necessary to understand the demand and supply dynamics within the laboratory education field.For several program types (CG, MLS, Path A, and PBT), the data show that the average number of qualified applicants exceeds program capacity. Conversely, programs such as DMS, HT/HTL, MLA, and MLT report fewer applicants than available capacity, highlighting the need for strategic marketing and recruitment initiatives to enhance applicant interest.
*Cohort definition: An academic cohort consists of a group of students enrolled in the same program, progressing through the same curriculum, and completing their degree together.
Table 4. Laboratory Workforce Pipeline Data (Self-Reported 7/1/2023- 6/30/2024)
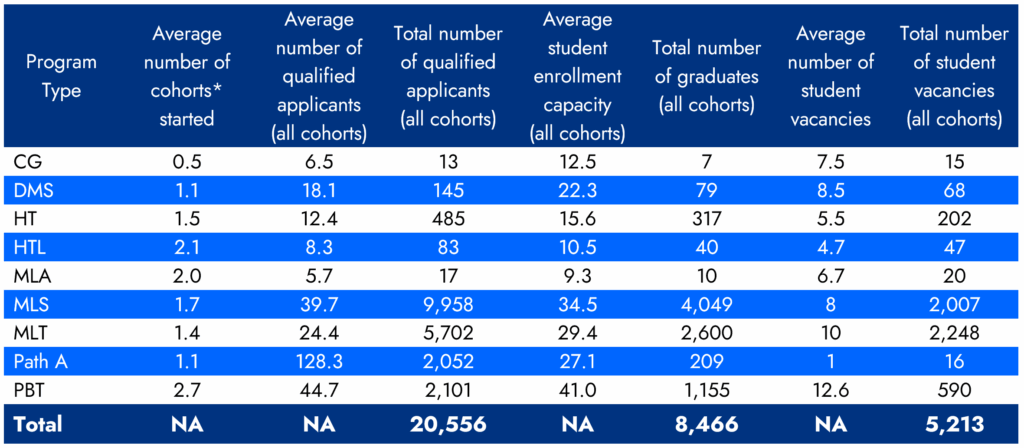
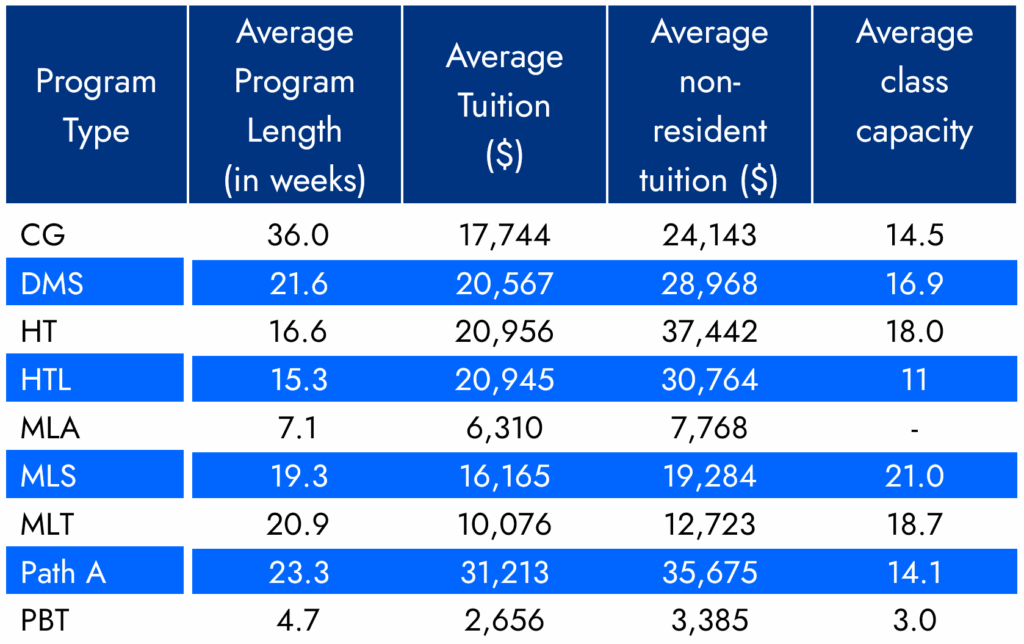
Table 5 below summarizes the average maximum number of vacancies reported by discipline, providing additional insights into the current workforce landscape. Table 6 presents data on program length, tuition costs, and class capacity for each discipline.
Table 5. NAACLS Data on Program Vacancies
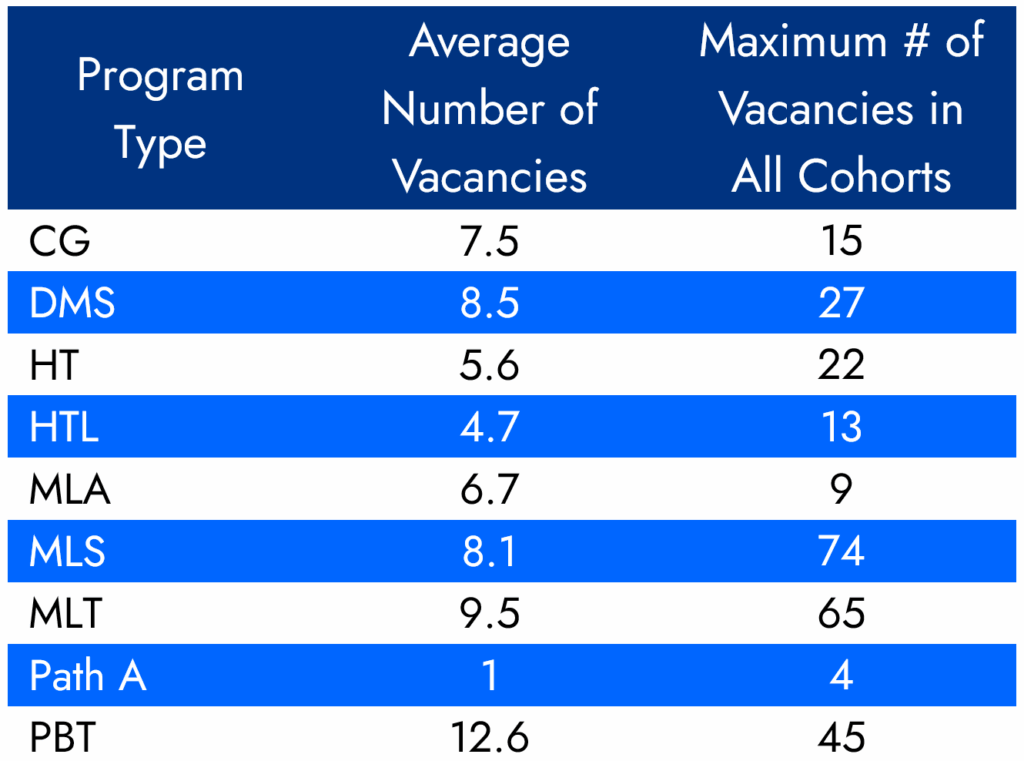
Table 6. NAACLS Program Length, Tuition, and Class Capacity by Discipline
Program Expansion Barriers
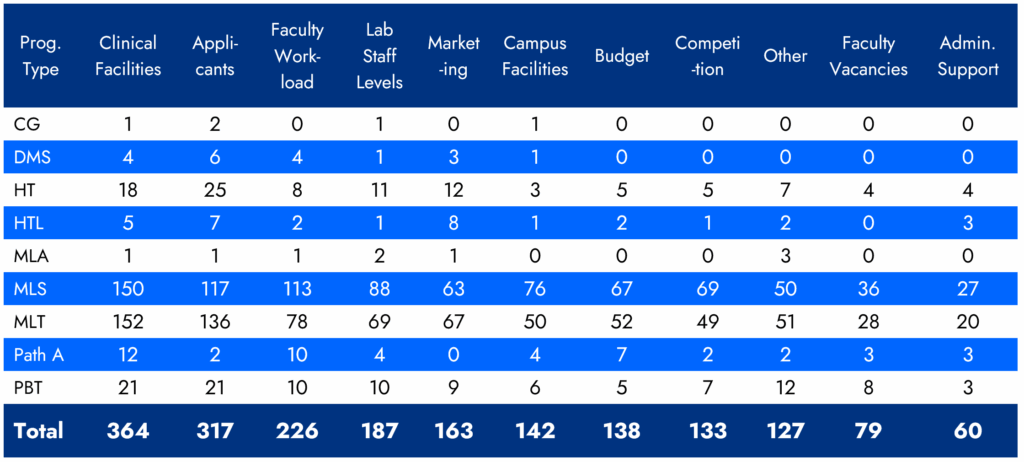
Based on feedback from last year’s survey, we expanded the list of potential barriers to program growth. For all 614 programs, the top two barriers remained unchanged: availability of clinical facilities and the number of qualified student applicants (Figure 9). In addition, laboratory staffing levels and current faculty workload emerged as significant challenges to expansion. Despite these barriers, many programs report vacant student slots and filling these openings across disciplines could help ease the workforce shortage. A discipline-specific breakdown of responses is provided in Table 7, which reflects trends consistent with the broader laboratory profession.
Figure 9. NAACLS Program Expansion Barriers – Total
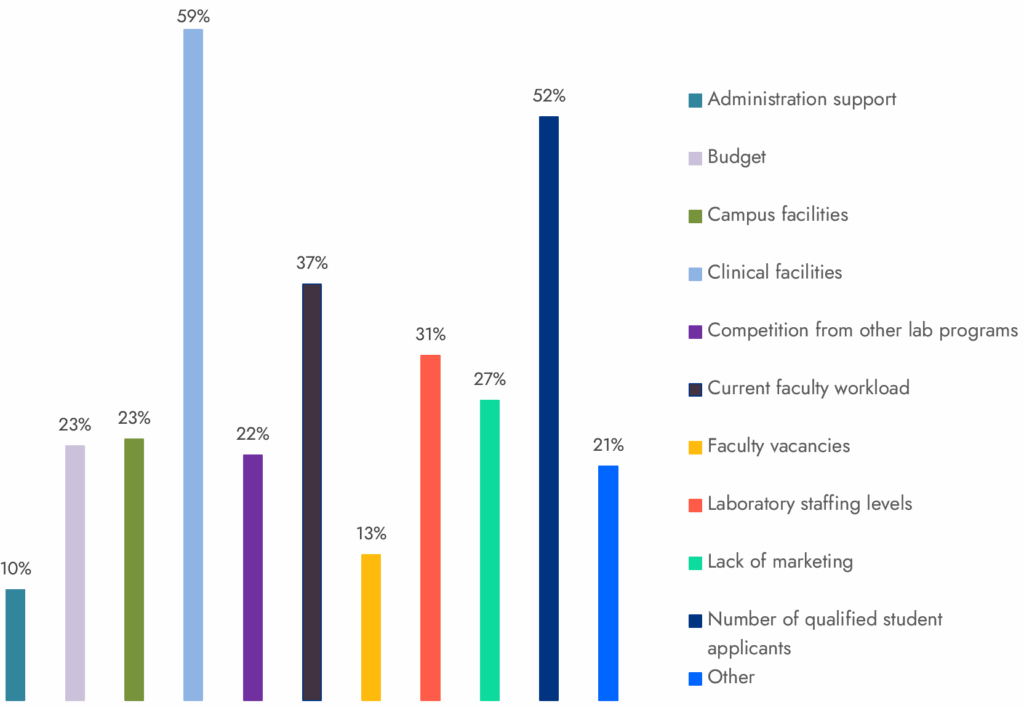
Table 7. NAACLS Program Expansion Barriers by Discipline
Benchmarks
NAACLS proudly upholds an outcomes-based approach to accreditation. The benchmarks we collect provide a clear measure of program effectiveness: the number of NAACLS Accredited Programs and graduates, certification examination pass rates, graduation rates, and job placement rates. These outcomes not only support the accreditation process but also serve students, prospective applicants, faculty, and administrators by demonstrating the ongoing strength and value of NAACLS-accredited education.
Each fall, we collect three major benchmarks from all of our programs:
- Certification exam pass rates: A three-year rolling average of at least 75% on accepted certification examinations taken within the first year after graduation.
- Graduate placement rates: A three-year rolling average of at least 70% of graduates employed or continuing their education within one year of graduation.
- Graduation rates: A three-year rolling average of at least 70% of students who begin the final half of the program successfully completing it.
Table 8 presents a three-year retrospective dataset of program average percentage rates for the three benchmarked outcomes. Percentages are stable throughout the three years of 2021-2023.
In the past three years, 20,377 students sat for the ASCP Board of Certification exams, and 320 individuals sat for the AMT exams.
Table 8. Average of Outcomes by Program Type
Note: Highlighted numbers fall below the benchmarks.
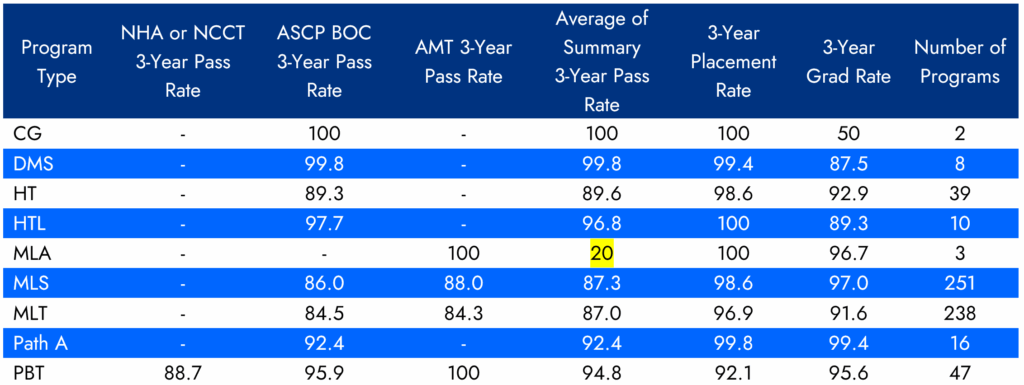
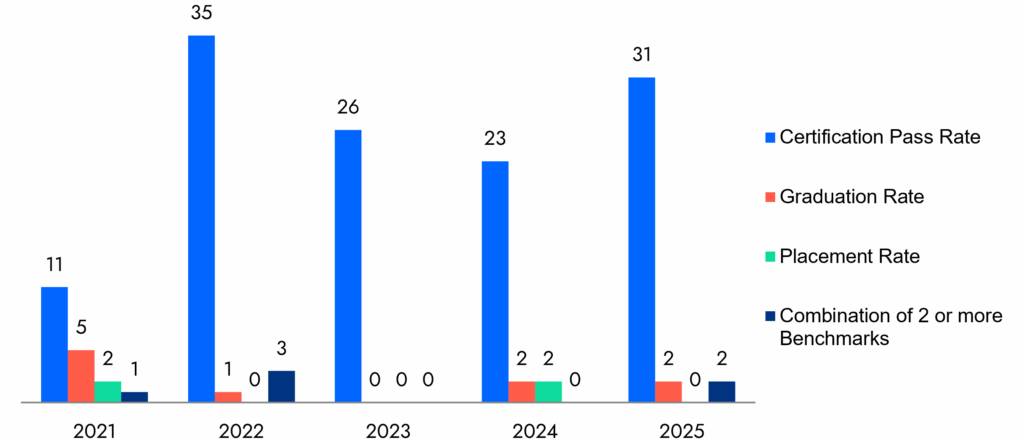
Figure 10 presents a five-year retrospective of the number of programs that did not meet the established benchmarks. NAACLS does not cite programs falling below these benchmarks. Instead, we request an Action Plan, which is due approximately two months after the Annual Survey of Programs closes. The data indicates an upward trend in the number of Action Plans submitted, with certification pass rates posing the most significant challenge. However, the majority of students continue to graduate successfully and either gain relevant employment or pursue further education, demonstrating the overall effectiveness of NAACLS Accredited programs.
Figure 10. NAACLS Action Plan Data From 2021-2025
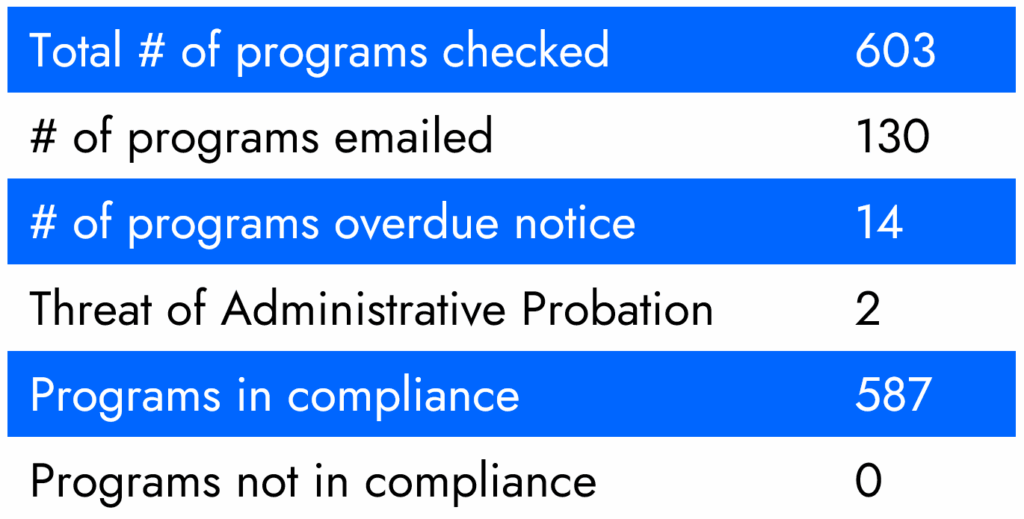
Each spring, NAACLS Staff sends program directors a courtesy email reminding them to ensure their program landing pages include their program outcomes on the website within two clicks. This is a requirement for our accreditor, the Council of Higher Education Accreditation (CHEA). NAACLS Staff contacted non-compliant programs in June 2025 and granted program directors 30 days to make the necessary changes.
Table 9 shows the tracking completed by NAACLS Staff to be in compliance with this CHEA requirement.
Table 9. Monitoring Student Accessibility to Program Outcomes
Changes in Program Resources
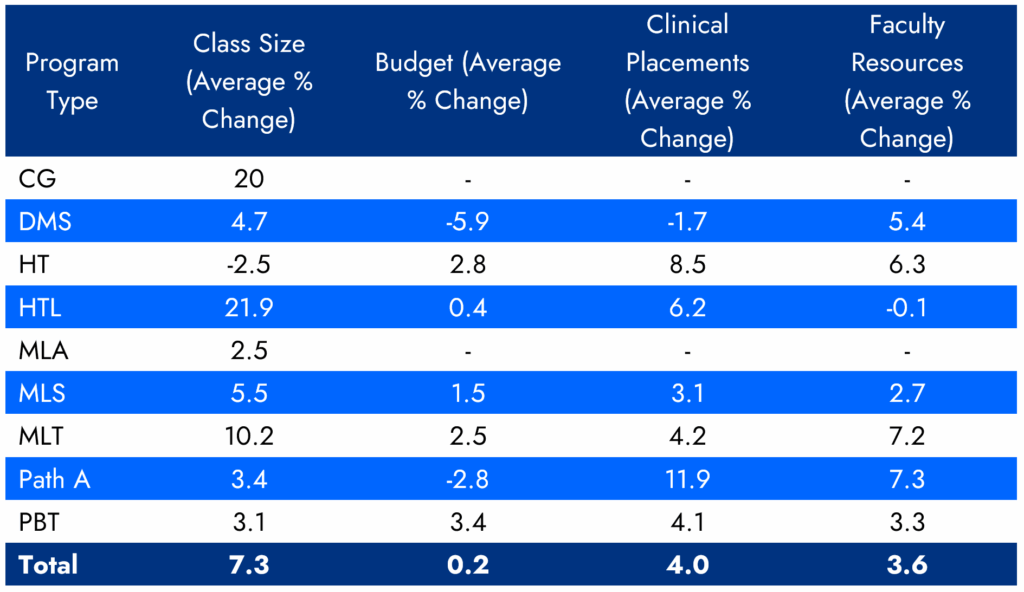
In the Annual Survey of Programs, NAACLS collects data on relative changes in program class sizes, budgets, clinical placements, and faculty resources. Table 10 presents year-to-year changes reported by programs for these characteristics. In recent years, programs have reported increases across all areas, with class sizes showing the greatest growth. Clinical placements and faculty resources have also increased, though to a lesser extent, while budget growth remains the most limited. Table 11 further breaks down these reported changes by discipline.
Table 10. Program Reported Changes 2021-2024
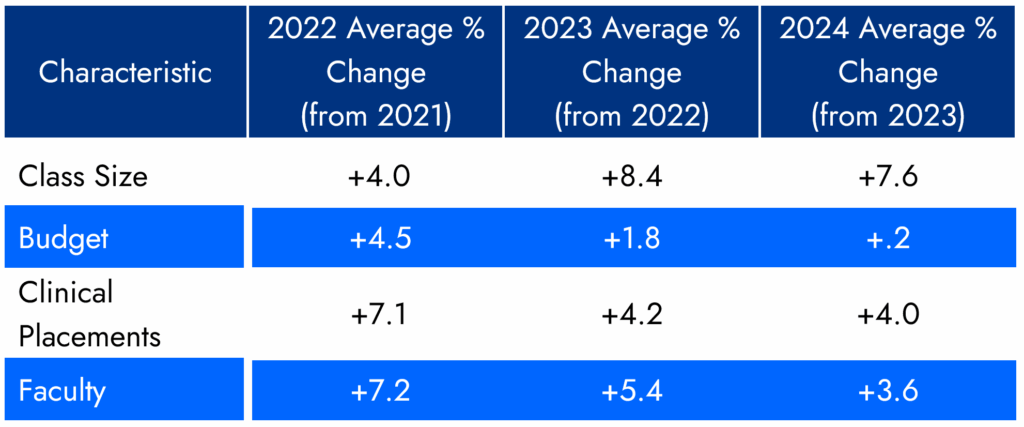
Table 11. Program Reported Changes by Discipline
Program Nomenclature
In 2021, the NAACLS Board of Directors endorsed the white paper “Standardizing the Professional Title of Medical Laboratory Professionals,” developed by the American Society for Clinical Laboratory Sciences (ASCLS) and the American Society for Clinical Pathology Board of Certification (ASCP BOC). To evaluate alignment with this initiative, NAACLS collected data on how closely program names correspond to their accreditation pathways.
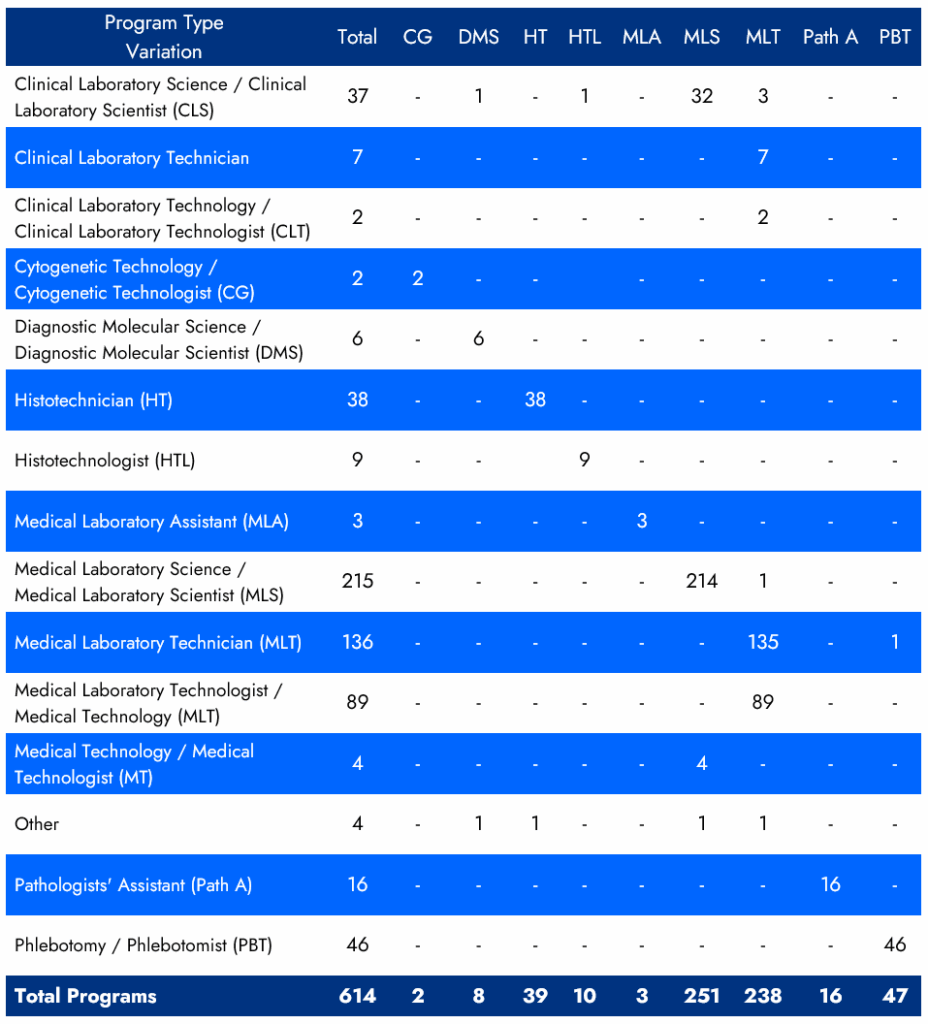
In the previous year, 198 MLS programs used the title Medical Laboratory Scientist Program. This year, that number has risen to 214, reflecting an 8% increase. Conversely, the number of MLS programs using the title Clinical Laboratory Science declined by nearly 18%. Only four programs continue to use Medical Technology as their MLS program name. Among Medical Laboratory Technician programs, several naming variations remain in use.
These findings reflect steady progress toward title standardization but also underscore the ongoing need for greater consistency across programs. Table 12 presents the various program names currently in use.
Resource: https://ascls.org/standardizing-the-professional-title-of-medical-laboratory-professionals/
Table 12. Program Name Variations for Program Types
New insights
Several new questions were introduced in the 2024 NAACLS Annual Survey of Programs to identify emerging trends within individual disciplines and across all programs. We hope you find that the resulting tables and figures offer valuable insights for the NAACLS Community and further support ongoing efforts to strengthen laboratory education.
Professional Phase
A hallmark of NAACLS Accreditation is its flexibility: programs are granted the autonomy to design structures that best align within their institutional context. To better understand this aspect, respondents were asked how their professional phase is delivered. NAACLS defines the professional phase as “characterized by learning advanced didactics along with technical and professional skill development in laboratory science, focusing on achieving entry-level competency distinct from other health science professions. This phase typically begins after students complete foundational coursework in basic sciences and general education.”.
Figure 11 illustrates the distribution of delivery methods in the professional phase. Nearly half of all programs reported offering instruction entirely in person during the weekday.
Figure 11. Distribution of Delivery Methods in the Professional Phase
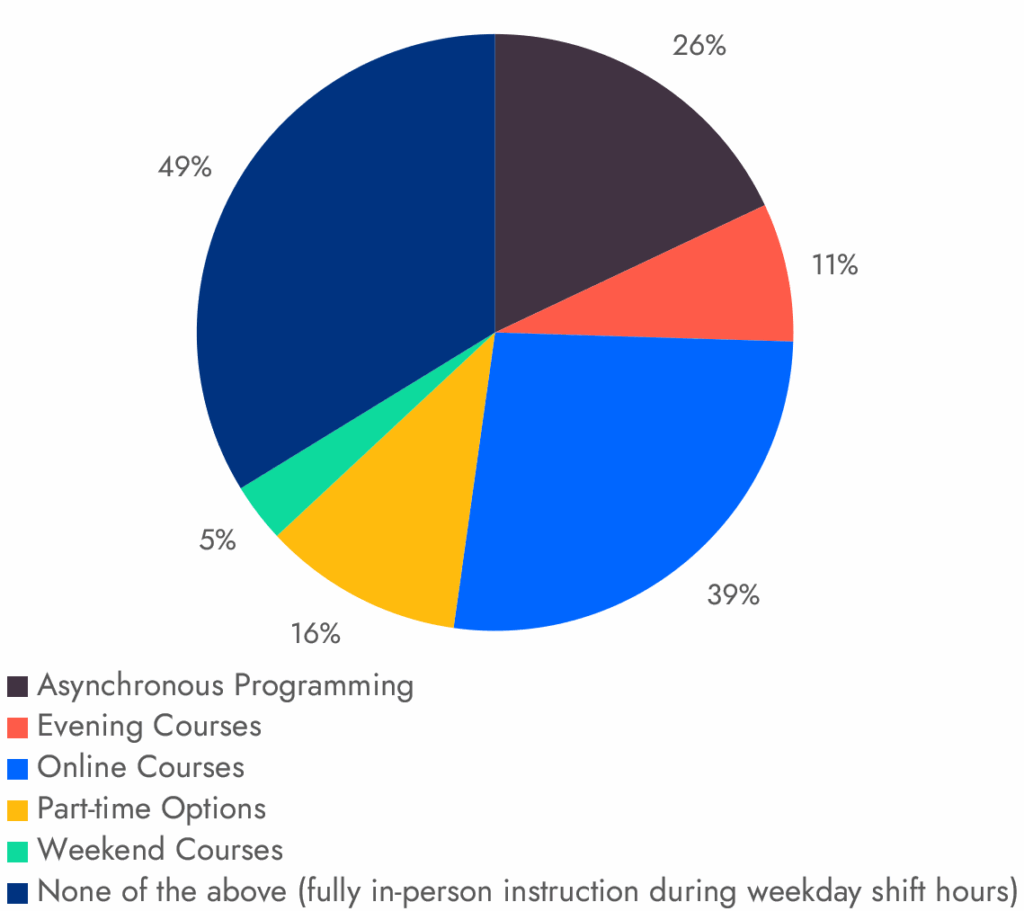
Table 13 and Figure 12 illustrate how students spend their time during clinical rotations (now referred to as clinical/applied learning). Monitoring how these percentages change over time will provide valuable insight into evolving educational practices.
Table 13. Average Estimated Percentage of Time in Clinical Rotation
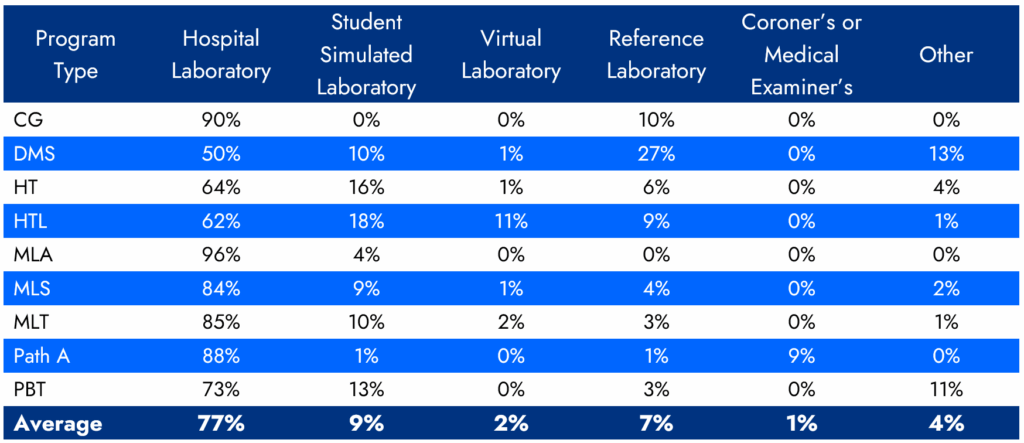
Figure 12. Average Percentage of Time in Clinical/Applied Learning Experience (Formerly Known As Clinical Rotation)
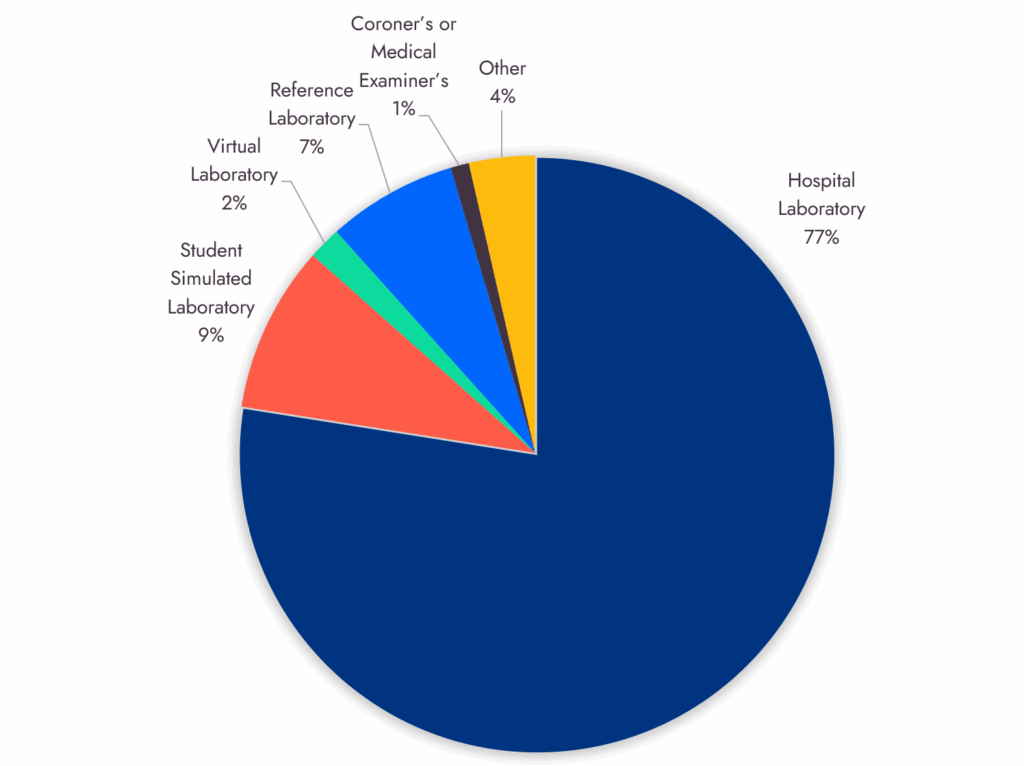
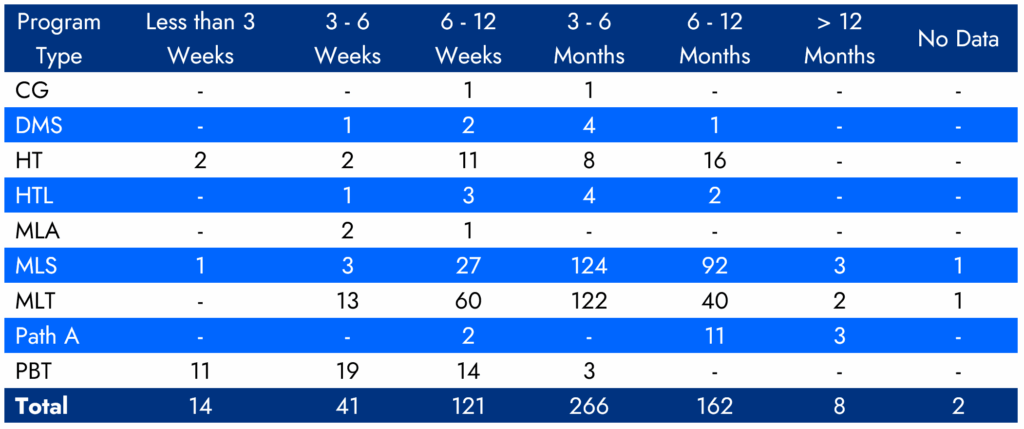
The time students spend in a hospital laboratory during their clinical/applied learning experiences (formerly known as clinical rotations) is presented in Table 14 and Figure 13, both overall and by discipline. We hope this information provides programs with useful context for comparing how clinical/applied learning experiences are structured across institutions.
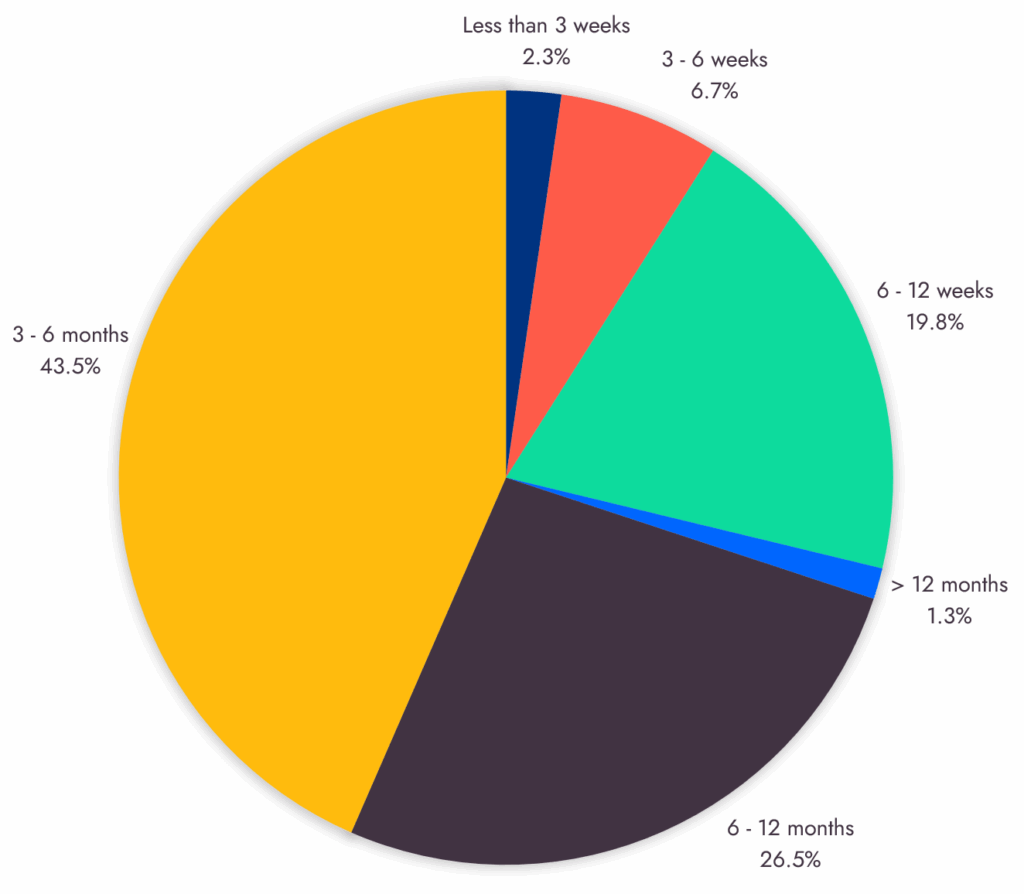
Table 14. Length of Time Students Spend in a Hospital Laboratory for Their Clinical/Applied Learning (Formerly Known as Clinical Rotation) By Discipline
Voluntary Withdrawal
NAACLS Staff reviewed Board actions dating back to September 2022 to identify trends related to program closures. Beginning in Fall of 2024, each time a NAACLS Program Accreditation Coordinator received a closure letter, a follow-up survey was sent to the affected program to collect additional information. Between September 2022 and June 2025, thirty-four (34) programs closed.
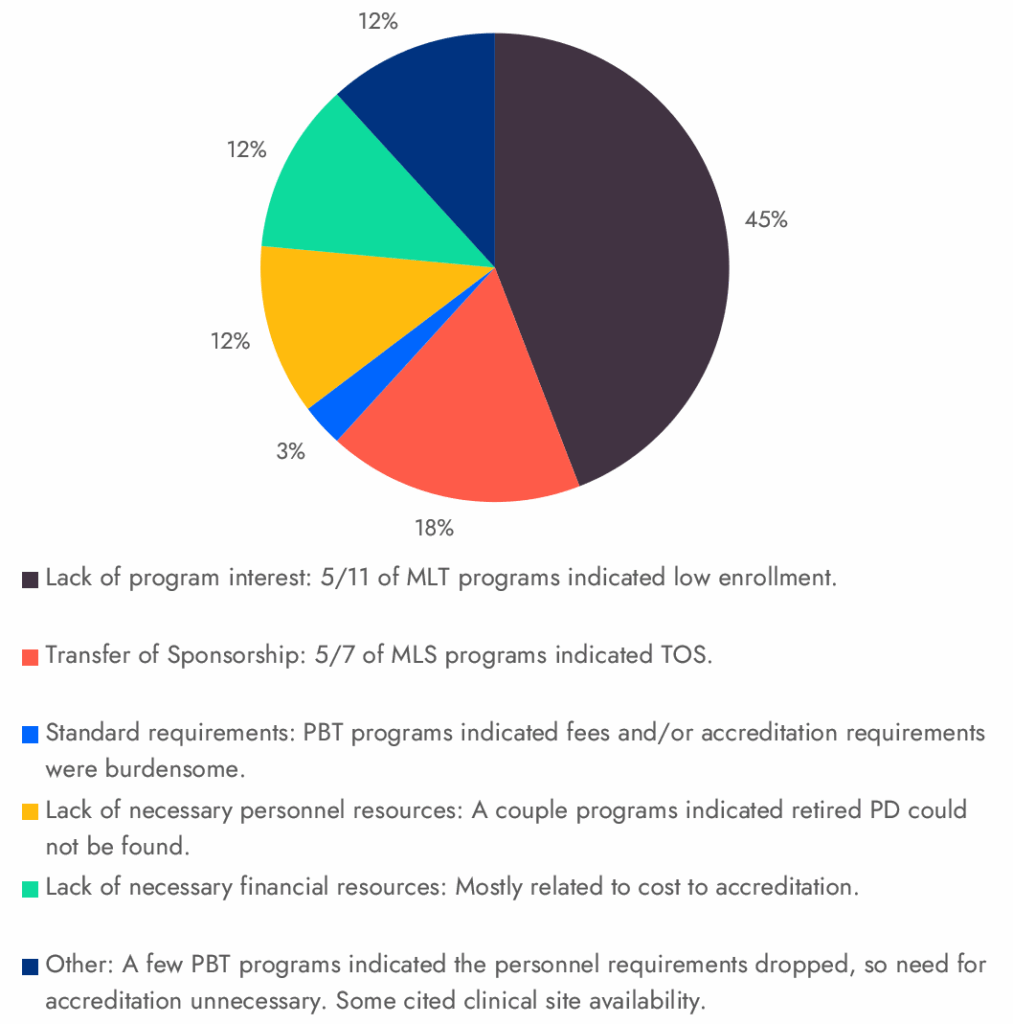
Figure 14 presents a pie graph showing the types of programs that closed, while Figure 15 provides additional detail on the primary reasons for voluntary withdrawal of accreditation.
Figure 14. Type of Programs Closed
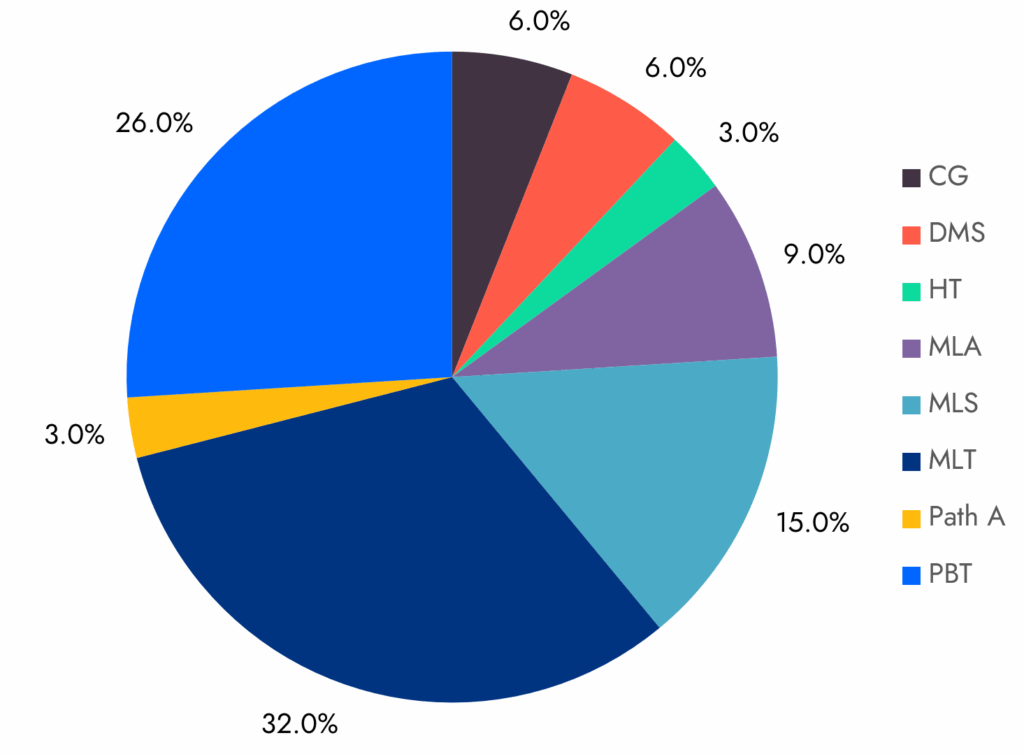
Figure 15. Primary Reason for Voluntary Withdrawal
Program Location heatmaps
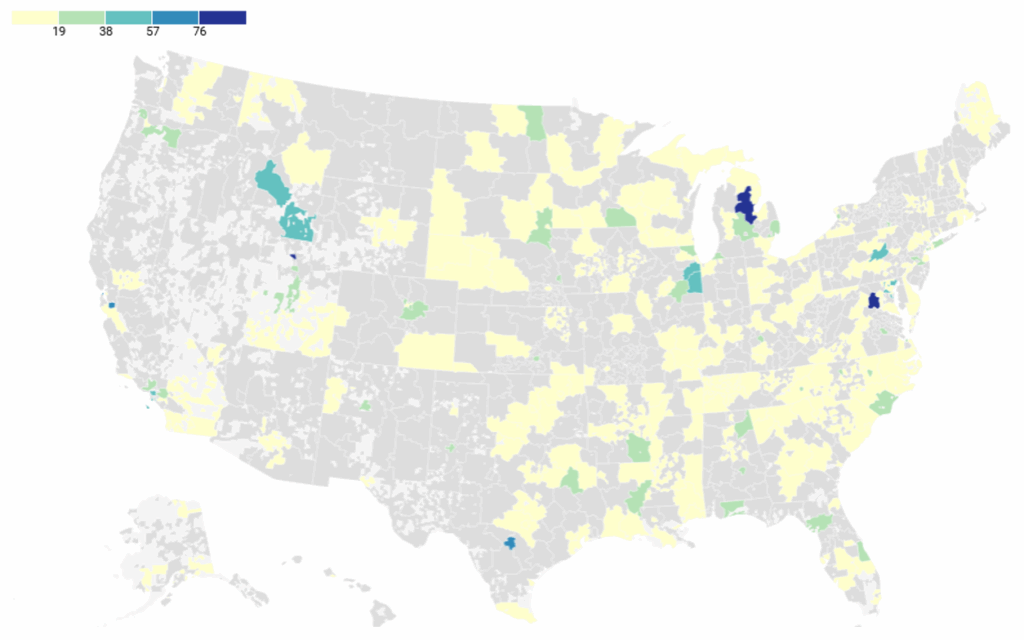
The two images below are graduate data by program location and zip code. They illustrate a bit of the difficulty showing the impact of approximately 8,800 NAACLS graduates annually. A scalable version of Figure 16 can be found here https://datawrapper.dwcdn.net/Gx6AJ/2/ and Figure 17 can be found here: https://datawrapper.dwcdn.net/D9xQX/1/
Figure 16. NAACLS Graduates by Program Location
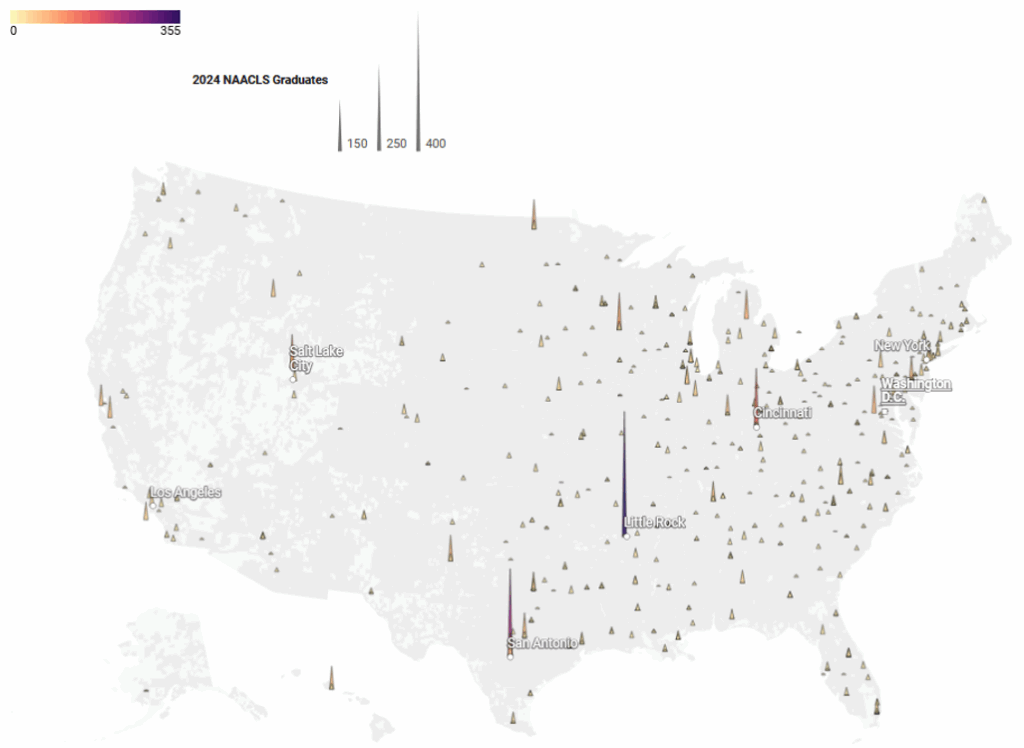
Figure 17. NAACLS Graduates in the USA by Zip Code
Reflections from the CEO
Over the past year, NAACLS has worked diligently to provide programs and stakeholders with richer data visualizations derived from the NAACLS Annual Survey of Programs. Through initiatives like the Workforce Action Alliance (WAA) and Medical and Public Health Laboratory Workforce Coalition, wehave committed to the goal of “Strengthen the data to understand the laboratory workforce.” These coalitions bring together leaders from laboratory accrediting agencies, professional organizations, educational institutions, and hospitals to collectively address workforce challenges and identify sustainable solutions.
The NAACLS 2024 Annual Survey of Programs included new and updated questions designed to be easier to answer while still capturing essential information. NAACLS Staff reviewed survey comments to identify ideas for new questions and suggestions to improve existing questions. We greatly appreciate the extra time programs have taken to assist us in this process.
The following new questions were introduced in the 2024 survey, and corresponding data visualizations were developed:
- Average percentage of programs that offer weekend, evening, online, or asynchronous options
- Voluntary Withdrawal Survey results
- Number of student applicants per cohort
- Student capacity by program
- Number of vacancies by program
- Length of time a hospital, simulated, virtual, reference, or medical examiner’s laboratory is used for clinical/applied learning (formerly known as clinical rotations)
- Identification of barriers to increasing student capacity by pathway
The data collected reveal many positive trends. Across several disciplines, we observed increases in both the number of accredited programs and the number of graduates. Programs are also reporting growth in faculty and clinical placement opportunities, most notably among Medical Laboratory Scientist (MLS) Programs. One area worth continued exploration, however, is whether increases in class size are being matched with proportional increases in other institutional resources, such as faculty and budget.
Importantly, the data continue to counter the often-quoted claim that NAACLS program numbers are declining. While the number of programs today differs from those in the 1990s, we see program numbers holding steady and graduation numbers continuing to rise. Interest in the laboratory profession appears to be strong, as evidenced by the number of qualified applicants. Although encouraging, we must ensure all students are successfully placed.
For disciplines experiencing declines in program or graduate numbers, we should ask: What more can be done to showcase the vital work and expertise of laboratory professionals to the broader community, students, administrators, and key decision-makers?
While the NAACLS Organization does not have all the answers, we believe it is essential for the laboratory community to collaborate on strategies to expand existing programs, establish new ones, and recruit the next generation of laboratory professionals to our beloved profession, all without overburdening current educators, administrators, or clinical facilities.
We continue refining our survey questions to gather more meaningful insights from programs. The additional visualizations highlight the creativity and adaptability of NAACLS-accredited programs, a flexibility made possible by NAACLS’ Standards, which allow institutions to tailor educational models to their unique resources and contexts.
The data collected from the Annual Survey can also serve as a worthy advocacy tool. Similar to other healthcare professions such as nursing, evidence-based data can help demonstrate workforce shortages, faculty or preceptor gaps, and other resource needs, potentially unlocking new funding opportunities from government or institutional sources.
Earlier this year, NAACLS launched an Advocacy Project featuring five NAACLS News articles, a CLEC presentation, and a live Dr. NAACLS Q&A with the project’s authors. We encourage you to visit www.naacls.org/news to view these materials. Simply filter by Featured to see all related articles and link to the Dr. NAACLS video recording. You will also find two advocacy template letters available on our website, one for starting a new program and another for sustaining an existing one. These can be found at the bottom of our Program Directors webpage. By using these resources, you can strengthen your advocacy efforts as you seek champions and institutional support for your programs.
Conclusion and next steps for the NAACLS Annual Survey of Programs
As NAACLS continues to enhance its website, particularly the Program Search feature, students may soon be able to see whether programs offer categorical options under the auspices of an MLS program (via ASCP BOC Route 3). To support this, the 2025 survey included a new question to identify additional pathways offered and the number of graduates in these categorical areas, helping us to better track workforce trends.
NAACLS remains deeply committed to providing programs with data that are both meaningful and actionable. We will continue to enhance our survey tools and methodologies to ensure the information collected accurately reflects the evolving needs of the laboratory education community. When additional insights are needed, we will also reach out with focused requests designed to help programs make data-informed decisions and drive continuous improvement across the profession.
We hope this article has offered useful perspectives and practical value. NAACLS will persist in gathering and analyzing data to monitor trends, identify opportunities, and advocate for the continued growth of laboratory science education. The findings from the NAACLS Annual Survey of Programs will serve as a foundation for strengthening resources, supporting educators, and ensuring the long-term success of our accredited programs.
Disclaimer – This published information was developed from a survey of information submitted to NAACLS by NAACLS-accredited programs. The published information contains only historical information and does not contain any projected information. NAACLS has not verified the accuracy, completeness, or suitability of any published information, and it does not recommend, encourage or endorse any use of the published information. NAACLS makes no warranty, guarantee or representation whatsoever, and assumes no liability or responsibility in connection with the use or misuse of this publication.