
CEO’s Corner: Findings from the 2025 Annual Survey of Programs
By Marisa James, Chief Executive Officer, and Elizabeth Swartz, IT Manager
Each fall, program directors of all NAACLS-accredited programs are invited to complete the Annual Survey of Programs. As a required component of accreditation, this survey serves a vital role in supporting compliance with NAACLS Standards, while also providing valuable insights into the current state of laboratory science education.
In recent years, the Annual Survey of Programs has evolved to capture a broader range of information that reflects changing educational practices and workforce needs. This year’s survey includes trends in program resources over the past few years as well as categorical program insights. These additions help identify emerging patterns, inform discussions across the laboratory education community, support efforts to strengthen programs, and prepare the future laboratory workforce.
Please note that Cytogenetic Technologist (CG) programs are excluded from most of the data presented in this article due to their limited number, which poses challenges in maintaining confidentiality.
Accredited Program Data
In 2025, 615 NAACLS-accredited programs received the Annual Survey of Programs and self-reported their data. As Figure 1 shows, the number of programs has grown steadily over the past fifteen years, rising from 570 in 2011 to 615 in 2025. This sustained increase offers an encouraging perspective on the laboratory education landscape and sends a positive message to those considering careers in laboratory professions. Showcasing long-term growth reinforces confidence in the field and its educational opportunities. NAACLS leadership encourages program officials to use these positive trends when advocating for institutional support or recruiting prospective students. Evidence of continued growth across NAACLS-accredited programs can help strengthen conversations about the importance of investing in laboratory education and securing the resources needed for future success.
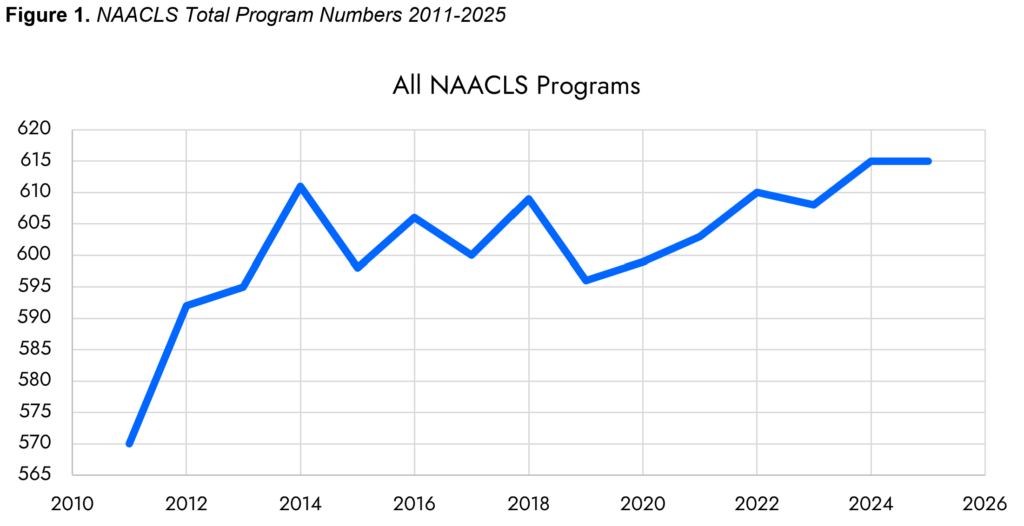
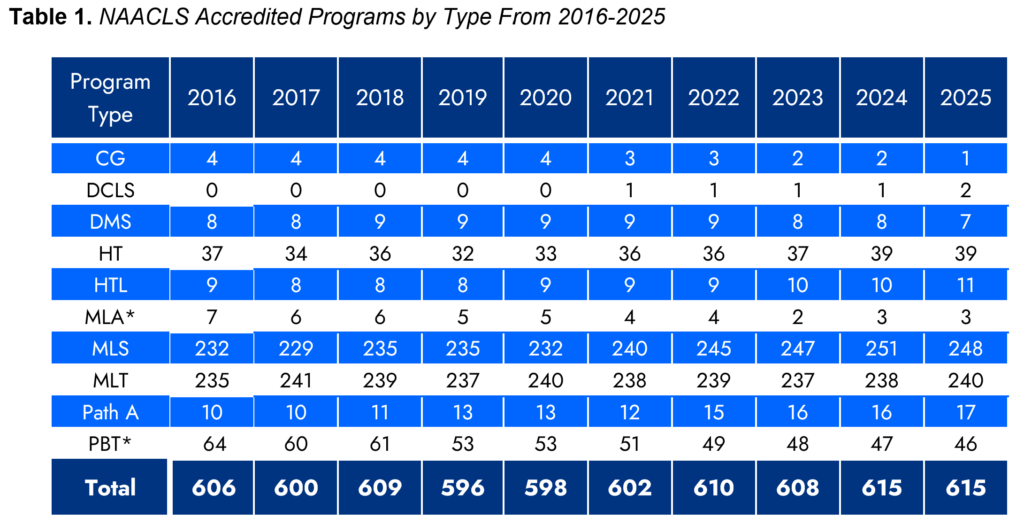
Table 1 (click on the chart to enlarge) illustrates ten-year longitudinal data on the number of programs by disciplines.Medical Laboratory Assistant (MLA) and Phlebotomy (PBT) programs transitioned from approved to accredited status in 2022; therefore, the current data include both accredited and approved statuses.* Pathology Assistant (Path A) programs grew the most in these 10 years. [Please note: NAACLS refers to these programs as Path A to avoid confusion with the Physician Assistant (PA), programs.] DCLS programs doubled, with two fully accredited programs and another in Doctoral Candidacy Status. Diagnostic Molecular Science (DMS), Histotechnician (HT), Histotechnologist (HTL), Medical Laboratory Scientist (MLS), and Medical Laboratory Technician (MLT) programs remained relatively stable. Meanwhile, the number of Cytogenetic (CG) and Medical Laboratory Assistant (MLA) programs declined by about half over the decade, and Phlebotomy (PBT) programs decreased by over 28%. It is especially concerning that only three MLA and one CG programs remain with little evidence of growth.
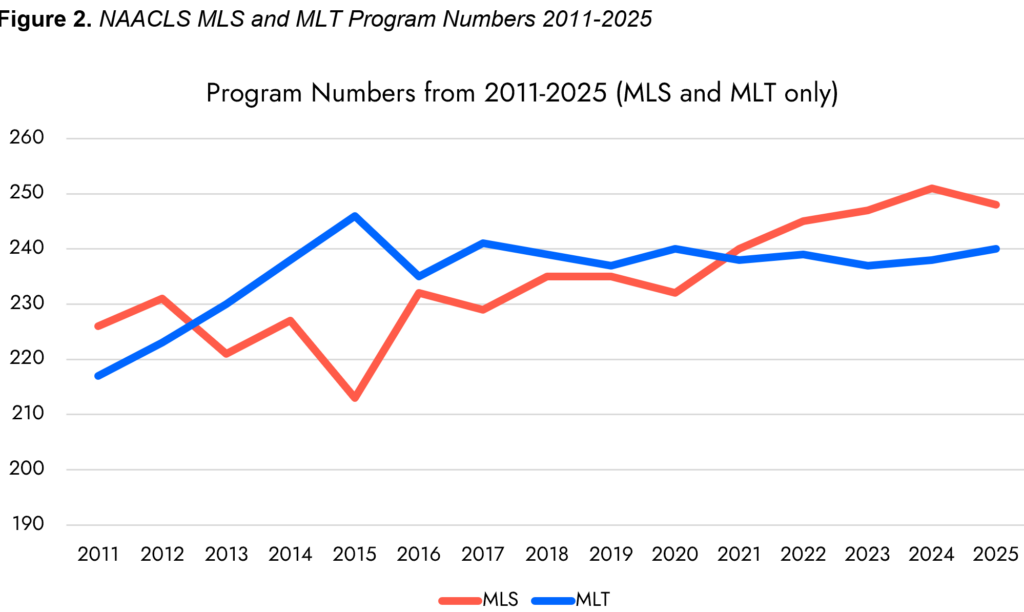
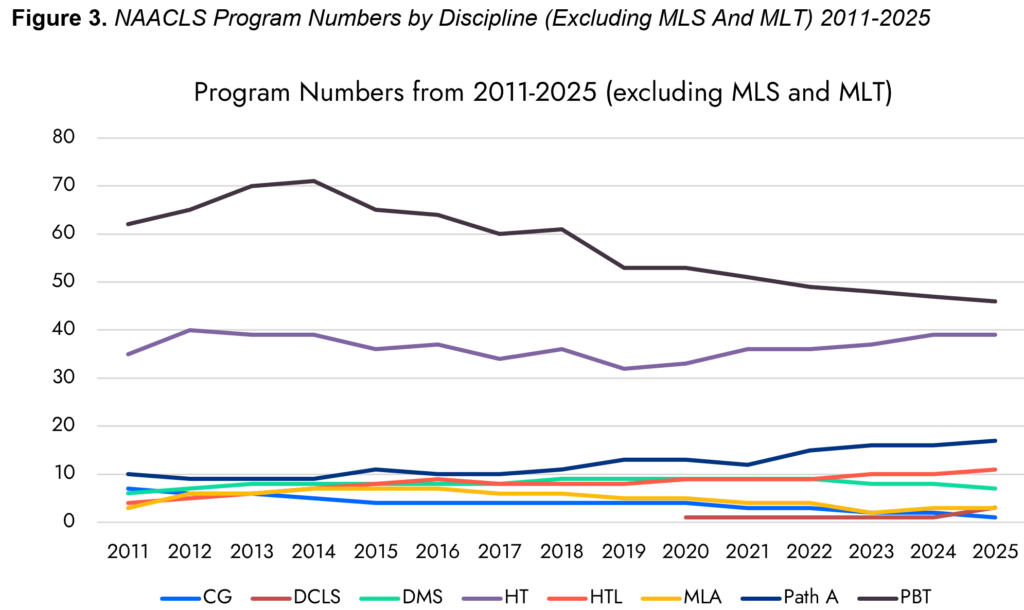
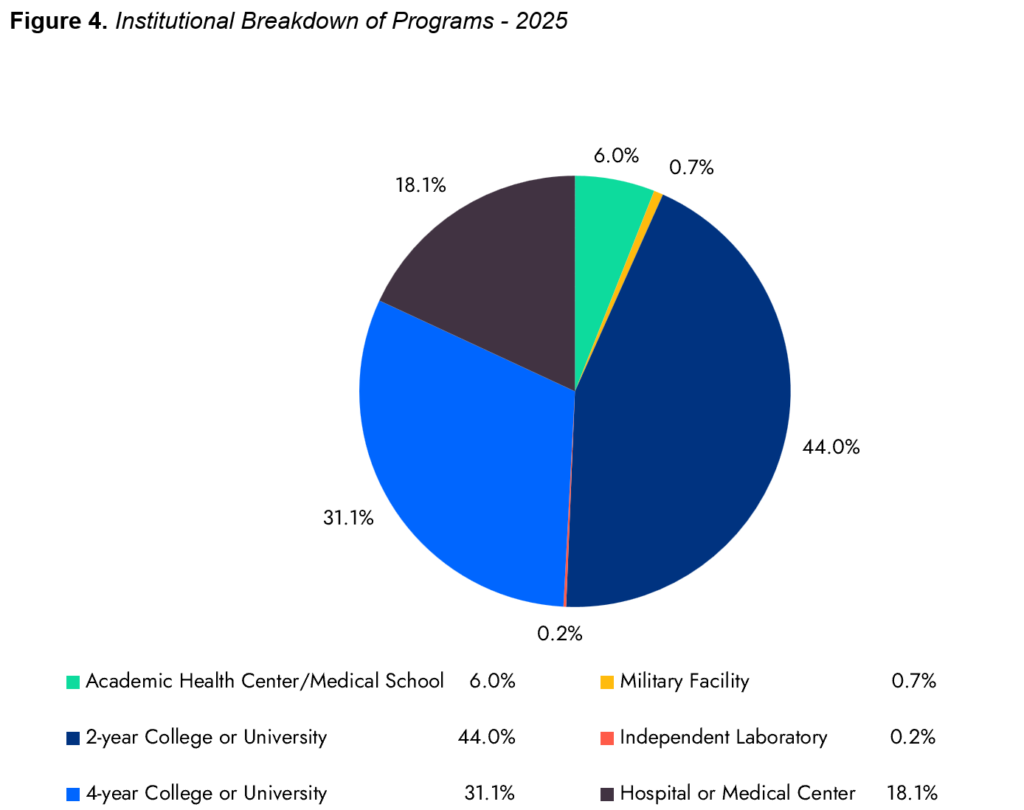
Figures 2 and 3 below present a 15-year overview with trend lines for the various program types, while Figure 4 illustrates the distribution of programs by institutional type.
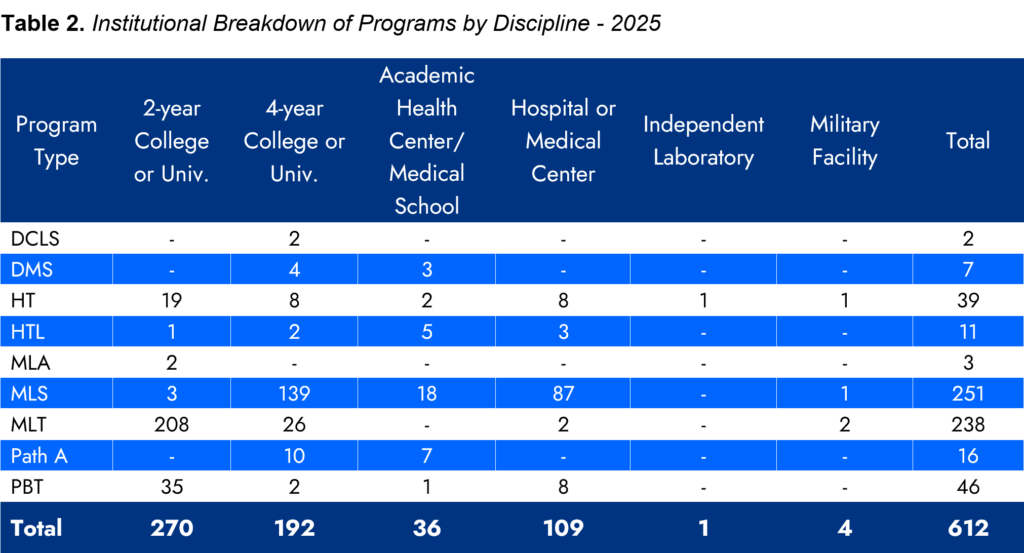
Thepie chart in Figure 4 shows the institutional distribution of programs in 2025. This information was further analyzed by discipline in Table 2 (click the chart to enlarge).
Initial Accreditation and Serious Applicant Status
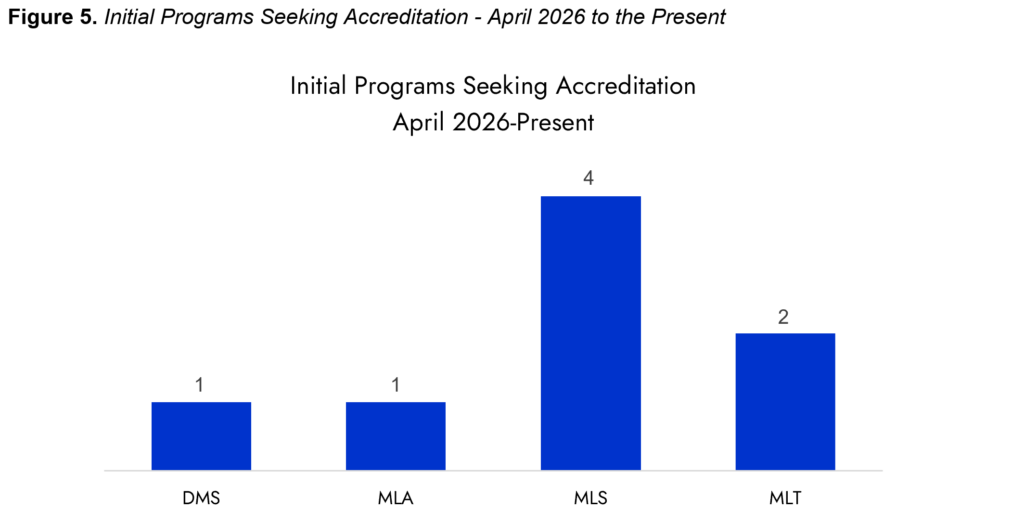
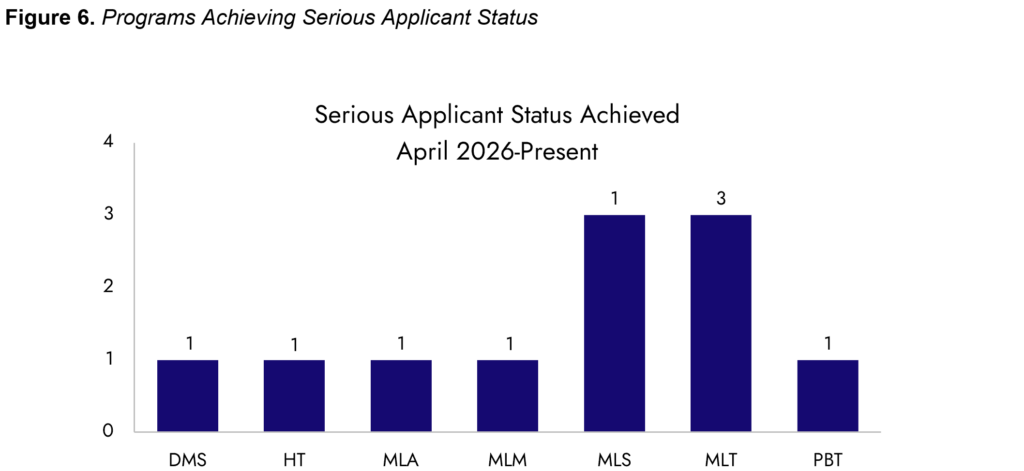
As of April 2026, 41 programs are progressing through the NAACLS Initial Accreditation Process. Among programs pursuing accreditation, eight have completed the Accreditation Application Packet since April 2026, as detailed in Figure 5. An additional 11 programs have attained Serious Application Status, as presented in Figure 6. This status allows students enrolled in these programs to pursue certification examinations through the NAACLS eligibility route while their program works toward full accreditation. Additionally, one Doctorate in Clinical Laboratory Science (DCLS) program continues to hold Candidacy Status.
Number of Program Graduates
Table 3 (click the chart to enlarge) and Figures 7 and 8 provide a fifteen-year perspective on graduate trends across NAACLS-accredited disciplines. While some disciplines have grown substantially, others have maintained relatively consistent graduate numbers or declined.
Pathologists’ Assistant programs (Path A) saw particularly notable growth, with graduates increasing by more than 80%, matching an expansion in the number of accredited programs. MLS graduates also increased by 37% during this period, reflecting growth in the number of programs and increased enrollment capacity within existing programs. In comparison, MLT programs have remained relatively stable in both program numbers and graduate output.
Conversely, the continued decline in CG, MLA, and PBT programs has been accompanied by a corresponding decrease in graduates. Numbers across the remaining disciplines have varied minimally.
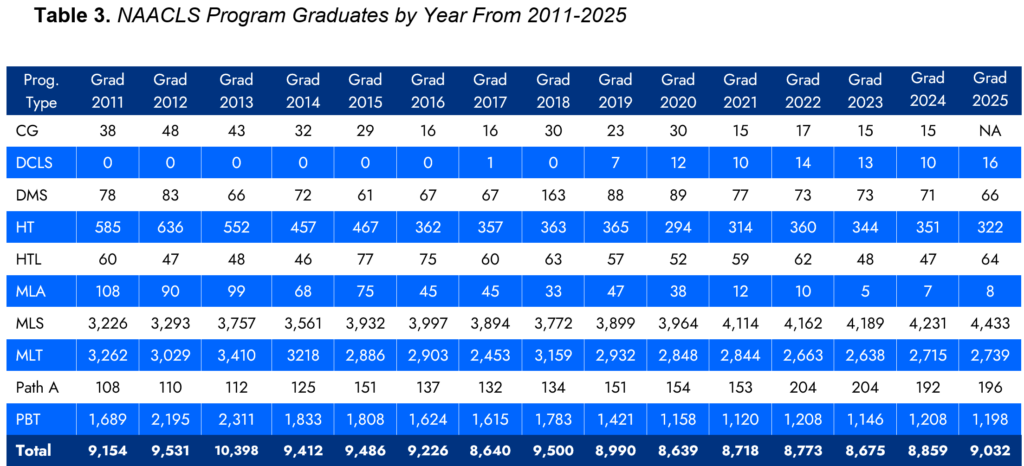
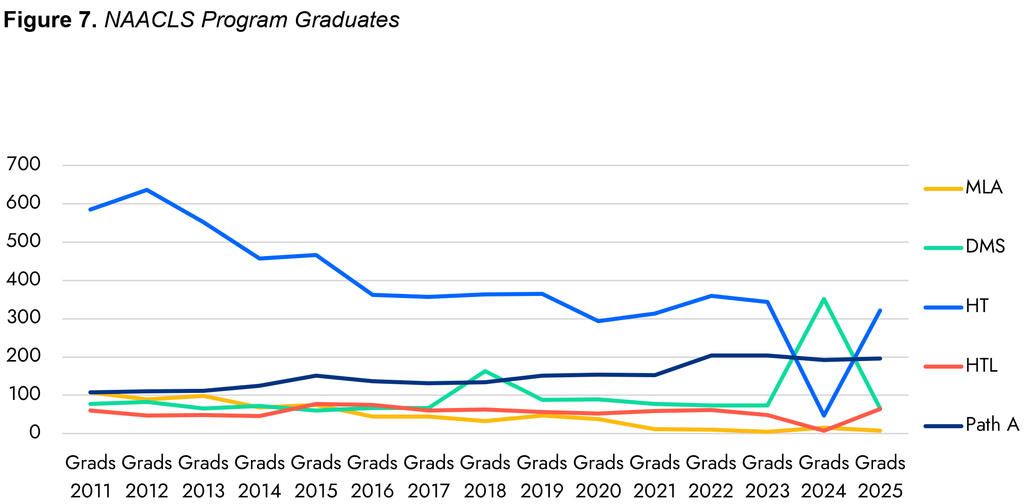
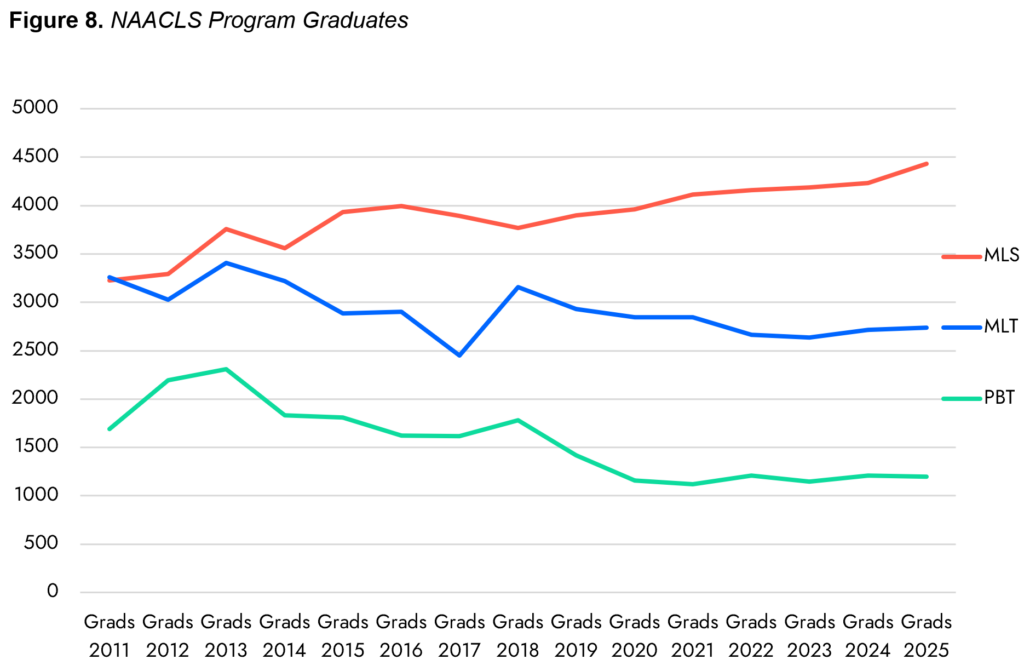
Table 4 provides a closer look at the laboratory workforce pipeline, including applicant numbers, program capacity, student enrollment, graduates, and vacancies across each discipline. Together, these data offer insights into the relationship between student interest, educational capacity, and supply and demand dynamics within the laboratory profession.
*Cohort definition: An academic cohort consists of a group of students enrolled in the same program, progressing through the same curriculum, and completing their degree together.
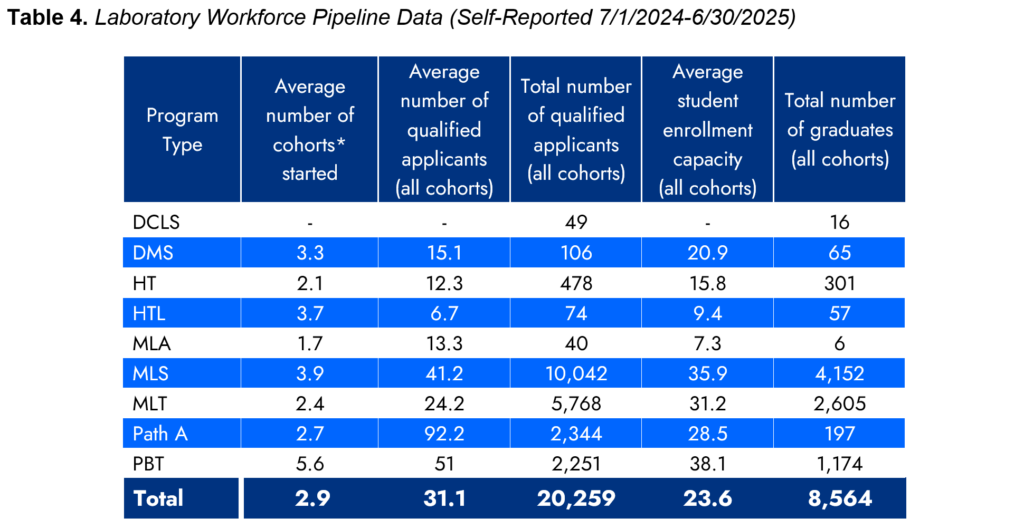
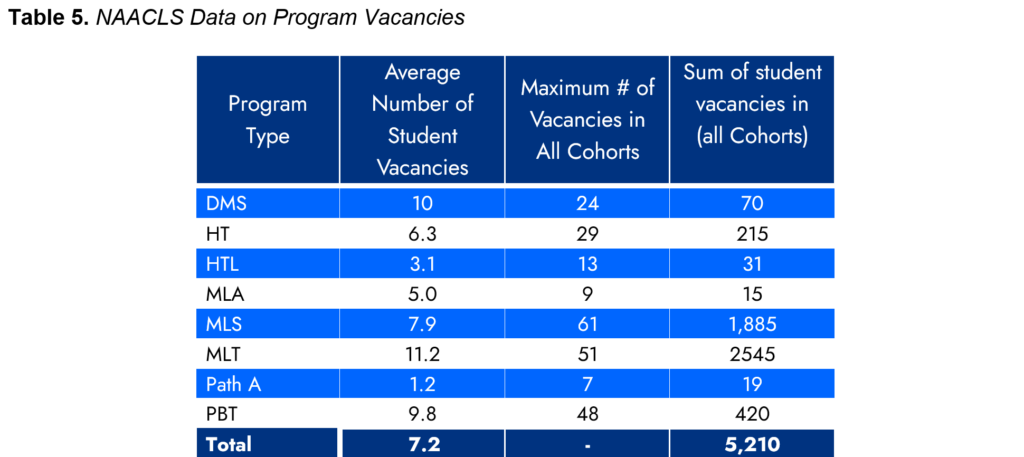
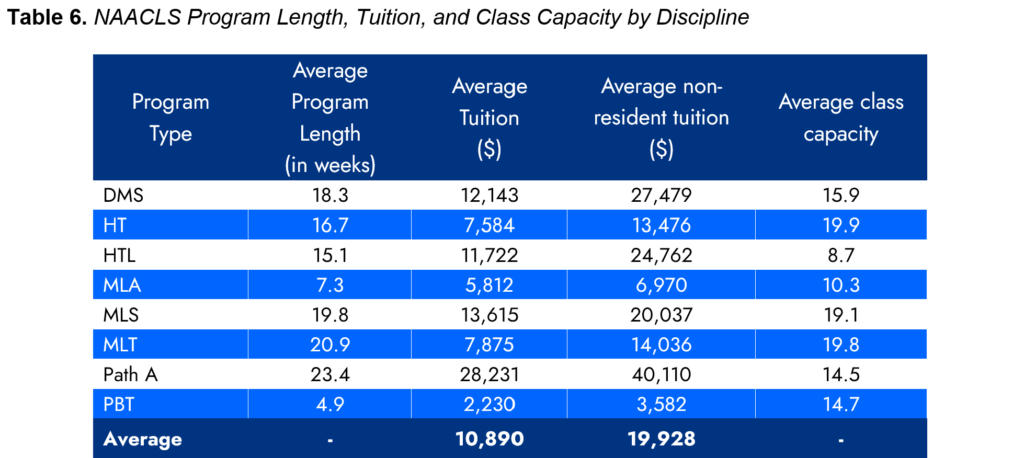
As seen in Table 5, several program types (MLA, MLS, Path A, and PBT) report that the average number of qualified applicants exceed the average number of student vacancies. This suggests expansion opportunities may exist where resources permit. In contrast, DMS, HT/HTL, and MLT report fewer applicants than available capacity. These differences highlight the varying recruitment and enrollment challenges across disciplines and reinforce the importance of targeted outreach, increased career awareness, and strategies to attract prospective students into the laboratory profession. Table 6 presents data on program length, tuition costs, and class capacity for each discipline.
Program Expansion Barriers
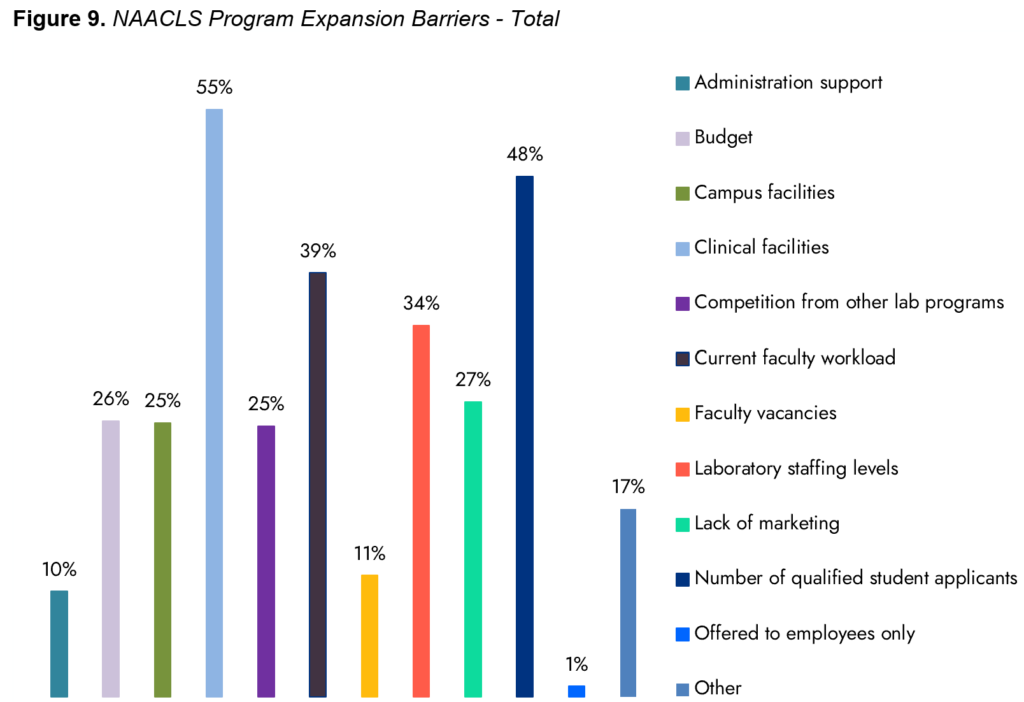
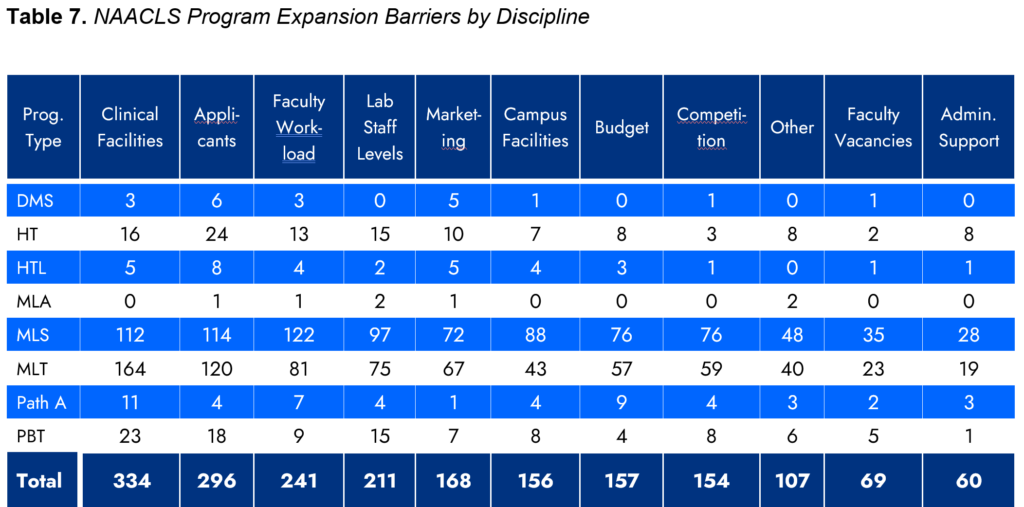
Across all programs, the top two barriers remain unchanged from the past three surveys: a limited number of clinical facilities and a limited number of qualified student applicants (Figure 9). Laboratory staffing levels and current faculty workload remain the next significant challenges to expansion. Despite these barriers, many programs report vacant student slots, and filling these openings across disciplines could help ease the workforce shortage. A discipline-specific breakdown of responses is provided in Table 7 (click the chart to enlarge), which reflects trends consistent with the broader laboratory profession. Open-ended responses from the Other category largely reinforce the barriers identified in the structured survey responses. Still, a recurring concern was the limited availability of specialized clinical rotations, particularly in microbiology and blood banking. Respondents frequently attributed these challenges to hospital mergers, laboratory consolidation, and staffing shortages that reduce clinical training capacity.
The shortage of qualified applicants may not always reflect inadequate recruitment. Respondents describe low awareness of laboratory careers, salary competition with other healthcare professions, student financial challenges, and academic preparedness challenges. Programs serving rural communities also described geographic limitations affecting both student recruitment and clinical placement opportunities.
Benchmarks
An outcomes-based approach remains central to the NAACLS accreditation process, providing measurable indicators of program quality and effectiveness. NAACLS benchmarks include certification examination pass rates, graduation rates, and job placement rates. These data serve as important resources for current and prospective students, faculty, program officials, and institutional leadership. Together, these benchmarks demonstrate the value of NAACLS accreditation, provide tangible evidence of program achievements, and reinforce the importance of maintaining high standards in laboratory education.
NAACLS Benchmarks:
Certification exam pass rates:
A three-year rolling average of at least 75% on accepted certification examinations taken within the first year after graduation.
Graduate placement rates:
A three-year rolling average of at least 70% of graduates employed or continuing their education within one year of graduation.
Graduation rates:
A three-year rolling average of at least 70% of students who begin the final half of the program successfully completing it.
Table 8 presents a three-year retrospective dataset of program average percentage rates for the three benchmarked outcomes, as defined above. In the past three years, 20,184 students sat for the ASCP Board of Certification exams, and 487 individuals sat for the AMT exams.
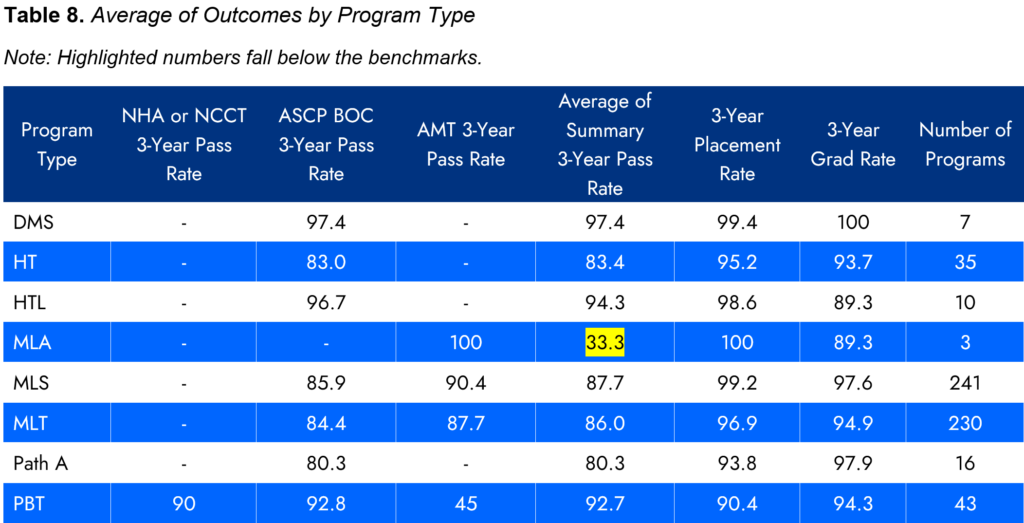
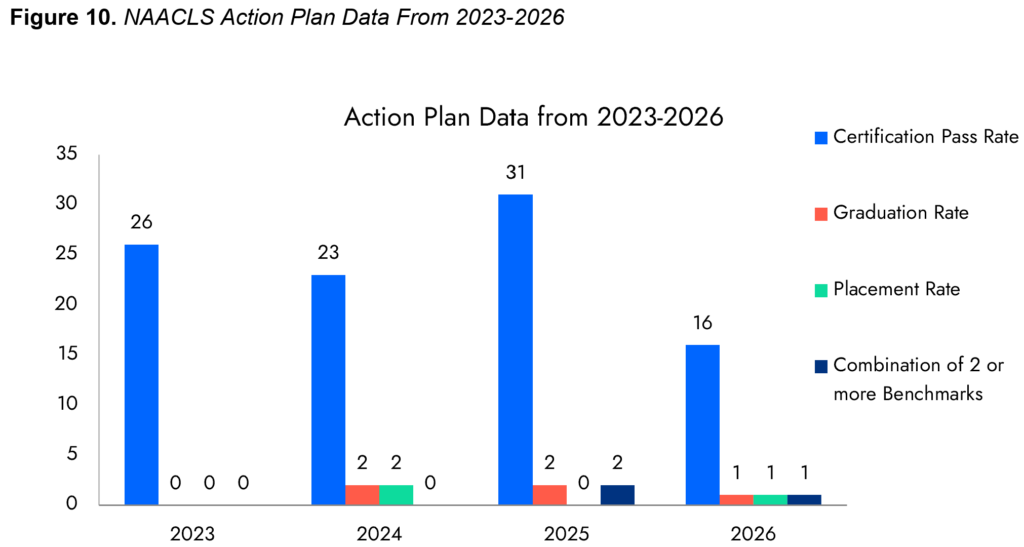
Figure 10 compares, over four years, the number of programs that did not meet the established outcome benchmarks. Rather than issuing citations for performance below these thresholds, NAACLS requires programs to submit an Action Plan, due approximately two months after the Annual Survey of Programs closes. These plans allow programs to evaluate their outcomes and identify strategies for improvement.
The most recent data show a significant drop in Action Plans submitted from 2025 to 2026, although certification examination pass rates remain the greatest challenge. It will be interesting to see whether this encouraging decline marks the beginning of a sustained trend in future reporting cycles. Nevertheless, most students continue to graduate successfully and secure employment in their field or pursue additional education, reflecting the overall strength and effectiveness of NAACLS-accredited programs.
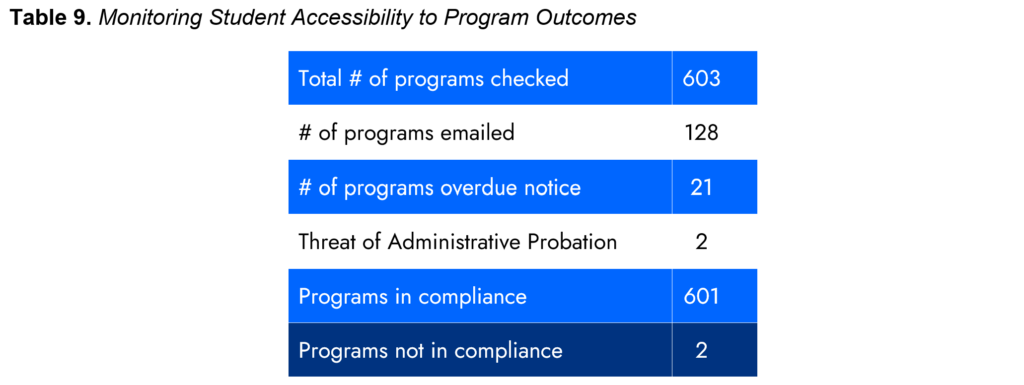
Each spring, NAACLS Staff reminds program directors of the importance of making program outcomes readily accessible on their program websites. As a Council of Higher Education Accreditation (CHEA) recognized accreditor, NAACLS programs must ensure that outcomes data is available within two clicks of each program’s landing page. This expectation promotes transparency and ensures that prospective students and other stakeholders can easily access information about program performance. As part of ongoing compliance monitoring, NAACLS Staff followed up with programs that had not met this requirement in June 2026, giving program directors 30 days to make the necessary updates.
Table 9 shows the number of programs that complied with the CHEA program outcomes requirement.
Changes in Program Resources
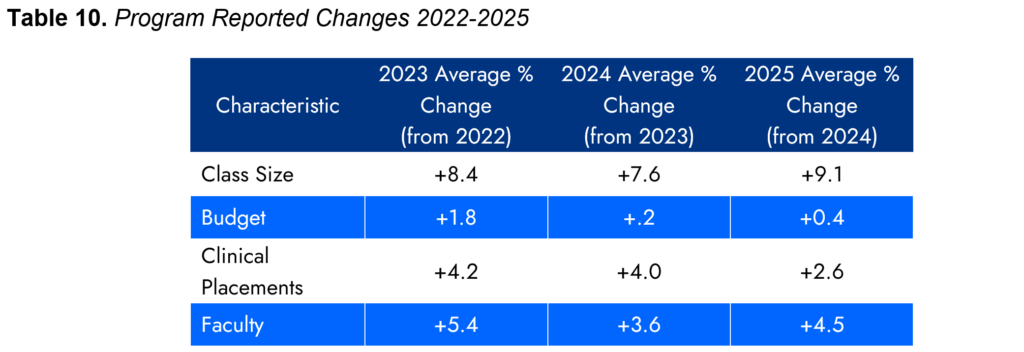
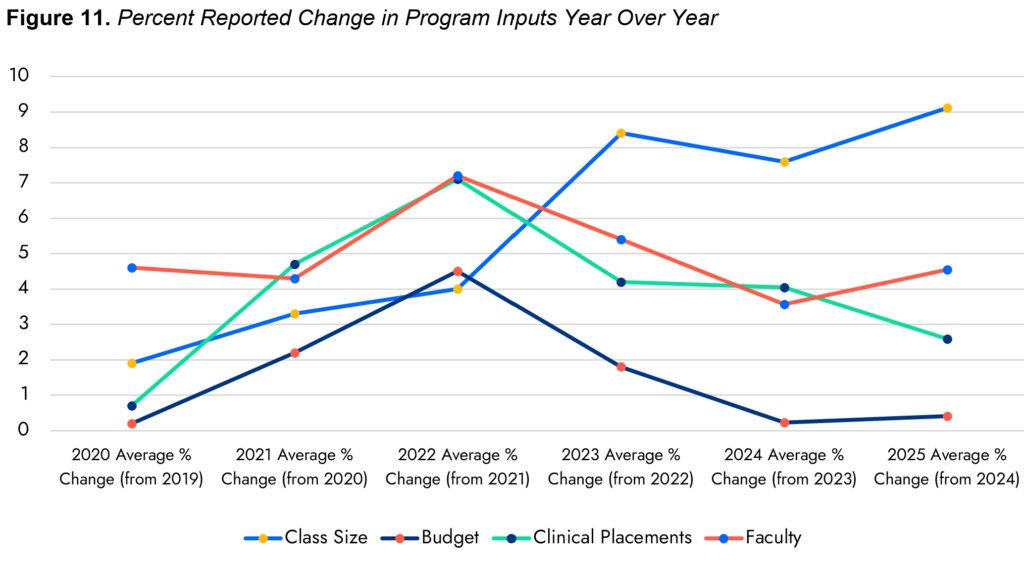
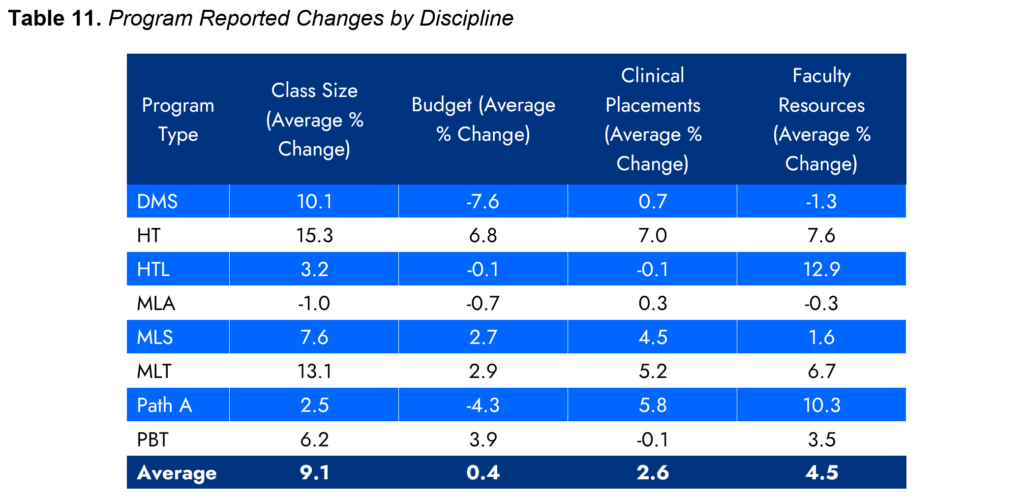
The NAACLS Annual Survey of Programs also examines changes in program resources, including class sizes, budgets, clinical placements, and faculty. Table 10 summarizes the year-to-year changes reported by programs, while Table 11 provides a more detailed breakdown by discipline. Although programs have reported growth across these areas in recent years, the increases have not occurred at the same pace. Class sizes have grown the most, while clinical placements, faculty resources, and budgets have grown more modestly.
A closer look at the six-year trends in Figure 11 reveals a growing imbalance between student enrollment and the resources needed to support it. While class sizes have continued to increase, reported changes in budgets, clinical placements, and faculty resources have generally trended downward. This divergence suggests many programs face increasing pressure to accommodate more students with proportionally fewer resources. The familiar expectation to “do more with less” seems especially relevant to laboratory education, underscoring the need to continue advocating for adequate funding, faculty support, and clinical training opportunities.
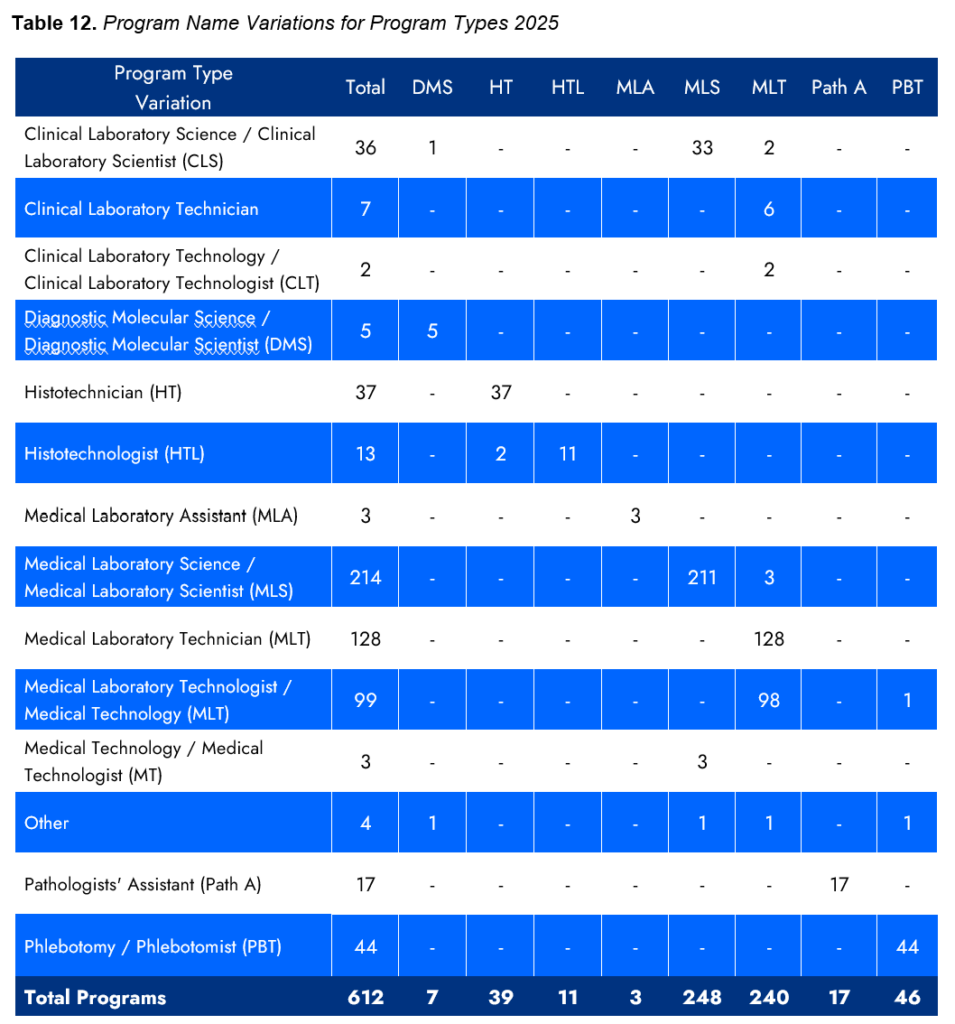
Following its endorsement of the white paper “Standardizing the Professional Title of Medical Laboratory Professionals,” NAACLS continues to monitor program nomenclature, particularly, Medical Laboratory Scientist Programs. This year, the number of programs using the MLS title increased from 198 to 214 (8%), while use of the Clinical Laboratory Science title declined by nearly 18%. Although progress toward standardization continues, naming variations remain across MLS and MLT. Table 12 summarizes current program nomenclature.
Resource: https://ascls.org/standardizing-the-professional-title-of-medical-laboratory-professionals/
Professional Phase
NAACLS-accredited programs have the flexibility to employ a variety of instructional approaches to meet the needs of their students and institutions. To examine these differences, programs identified the delivery methods used during their professional phase. NAACLS defines the professional phase as “characterized by learning advanced didactics along with technical and professional skill development in laboratory science, focusing on achieving entry-level competency distinct from other health science professions. This phase typically commences after students complete foundational coursework in basic sciences and general education.”
Figure 12 illustrates how professional phase delivery methods are distributed across all NAACLS-accredited programs. Nearly half of all programs reported offering instruction entirely in person during the weekday. Because programs may utilize multiple delivery methods, the percentages do not total 100%.
Table 13 breaks down instruction delivery methods by discipline.
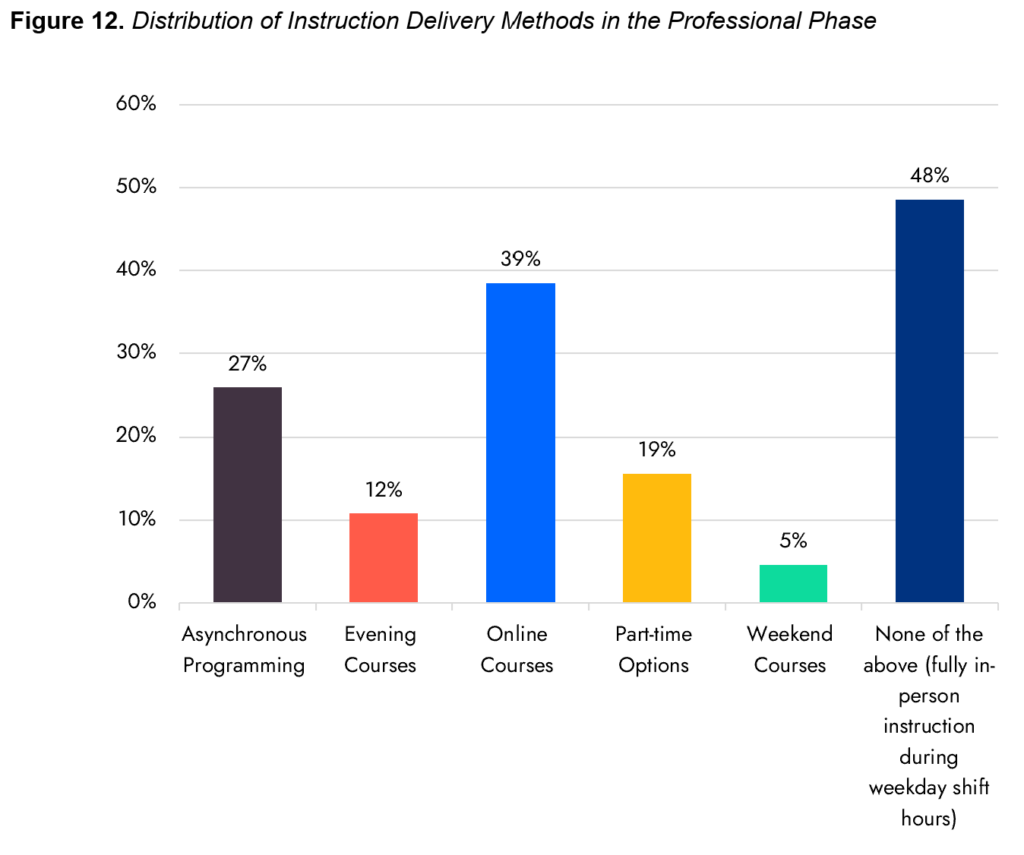
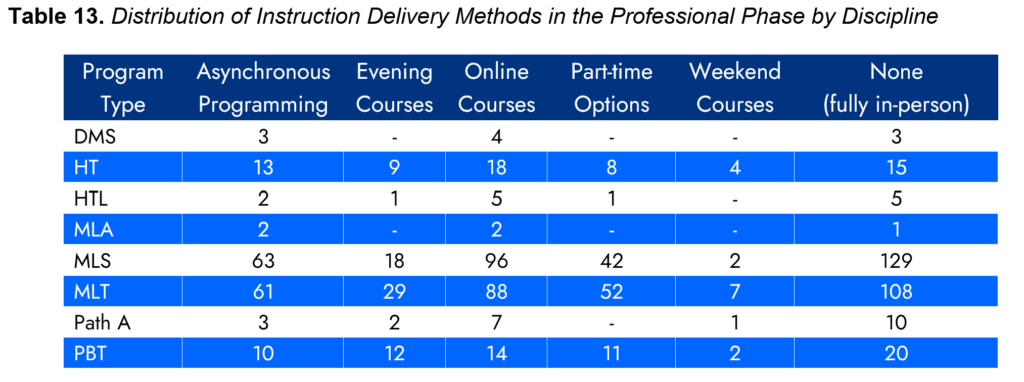
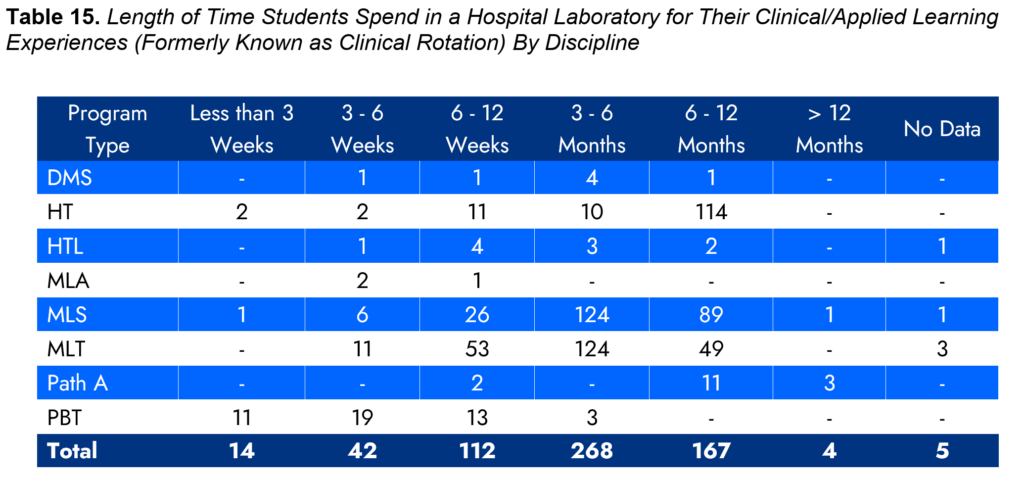
Table 14 and Figure 13 provide an overview of how students allocate their time during clinical/applied learning experiences (formerly referred to as clinical rotations). Tracking these distributions over time will help identify trends and shifts in educational practices.
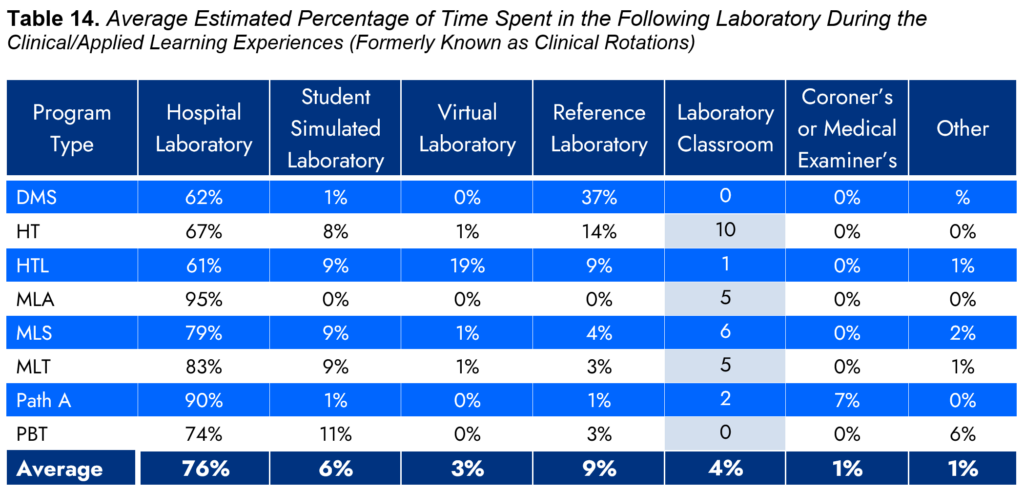
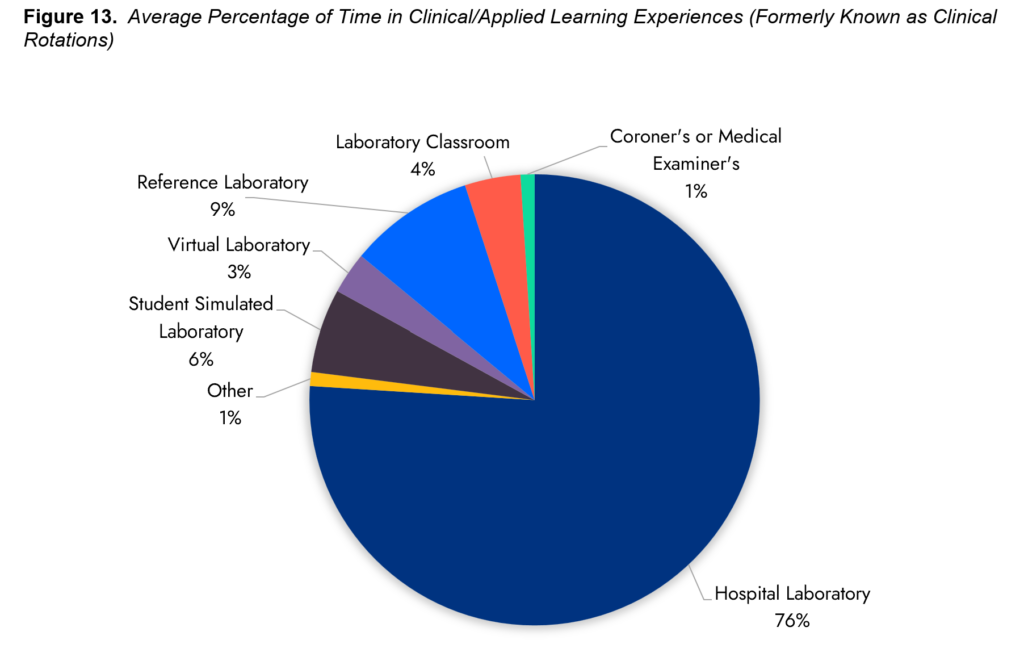
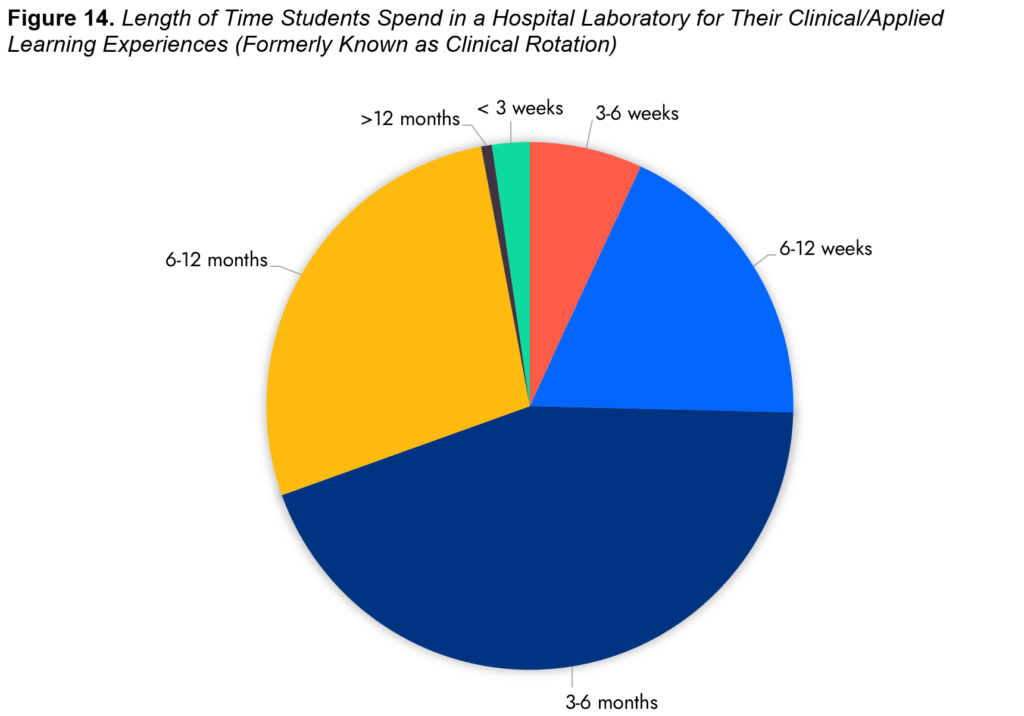
Figure 14 and Table 15 illustratethe amount of time students spend in hospital laboratories during their clinical/applied learning experiences (formerly referred to as clinical rotations), both overall and by discipline. These findings offer programs a useful point of comparison for understanding how institutions structure clinical/applied learning experiences.
Voluntary Withdrawal of Accreditation
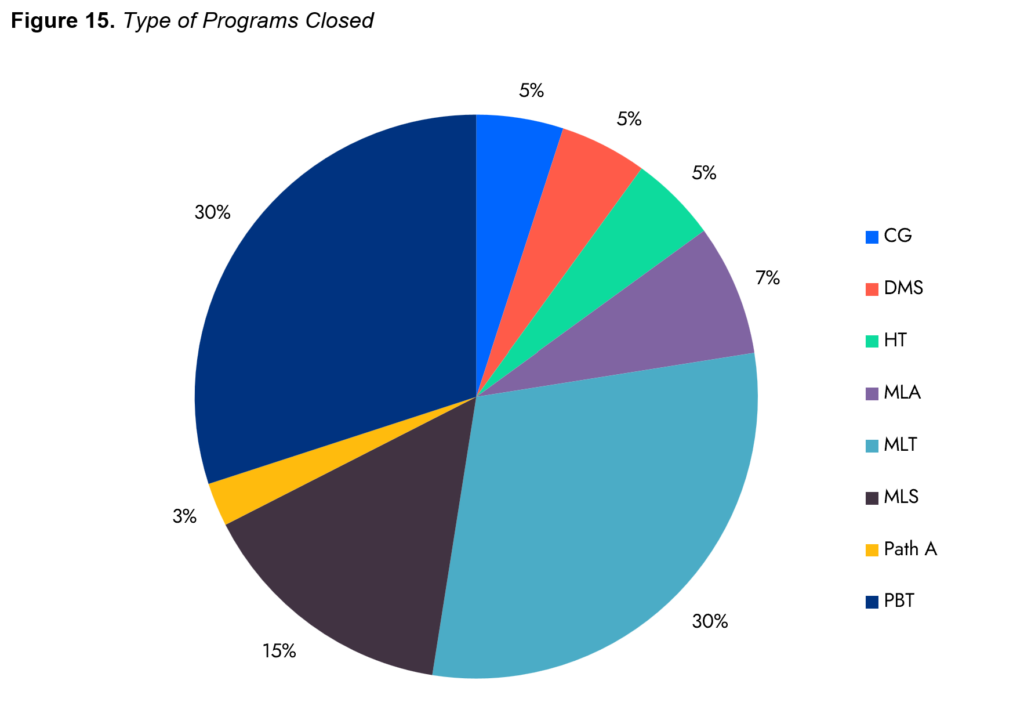
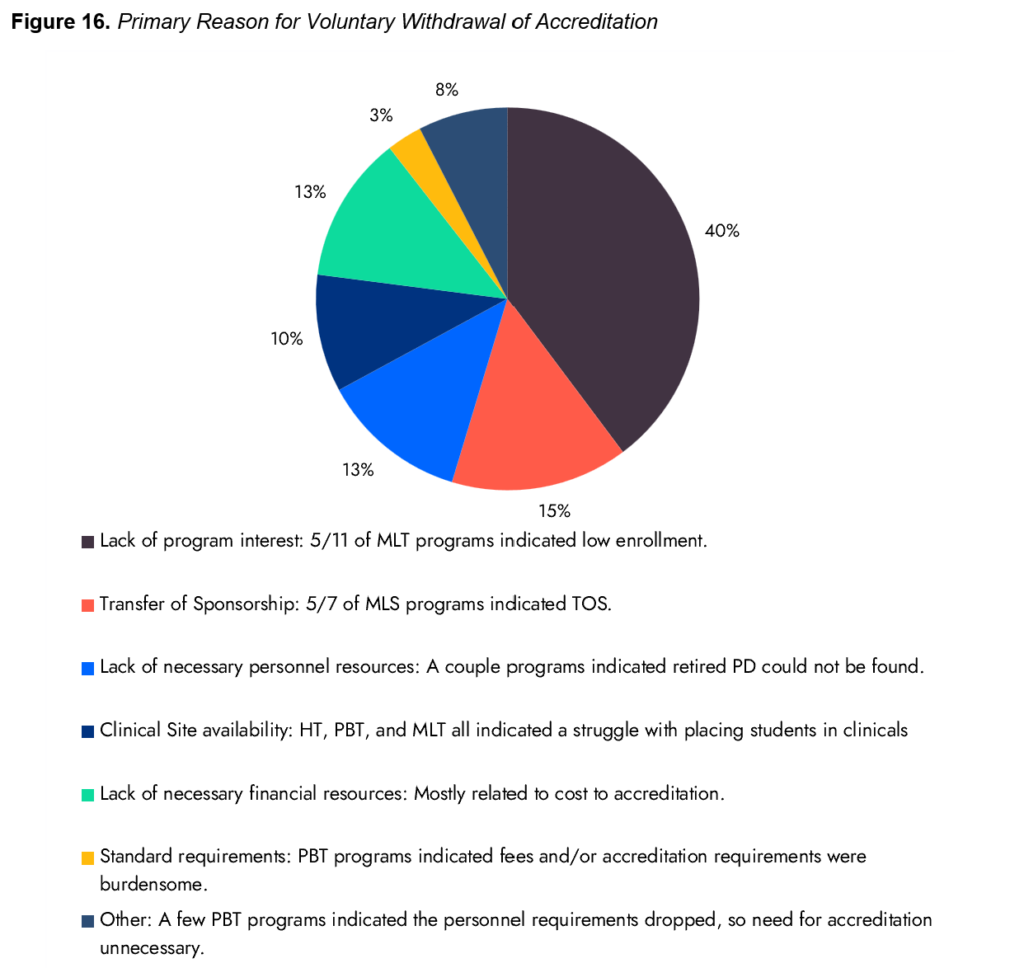
In September 2022, NAACLS Staff began tracking trends in program closures. Since that time, 40 programs have closed. Surveys were distributed to each affected program to understand the reasons for closure. Figure 15 illustrates the distribution of program closures by discipline, while Figure 16 highlights theprimary reasons for Voluntary Withdrawal of Accreditation. Understanding the factors driving program closures provides valuable insight into potential challenges and helps identify areas where targeted advocacy may be needed.
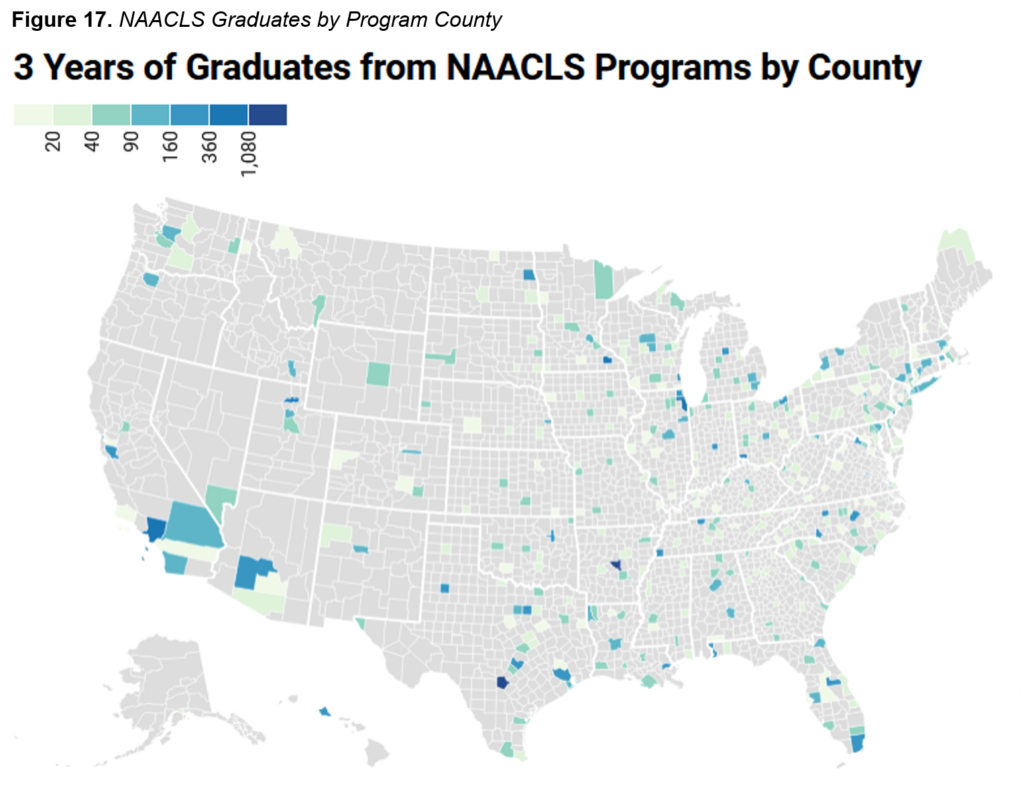
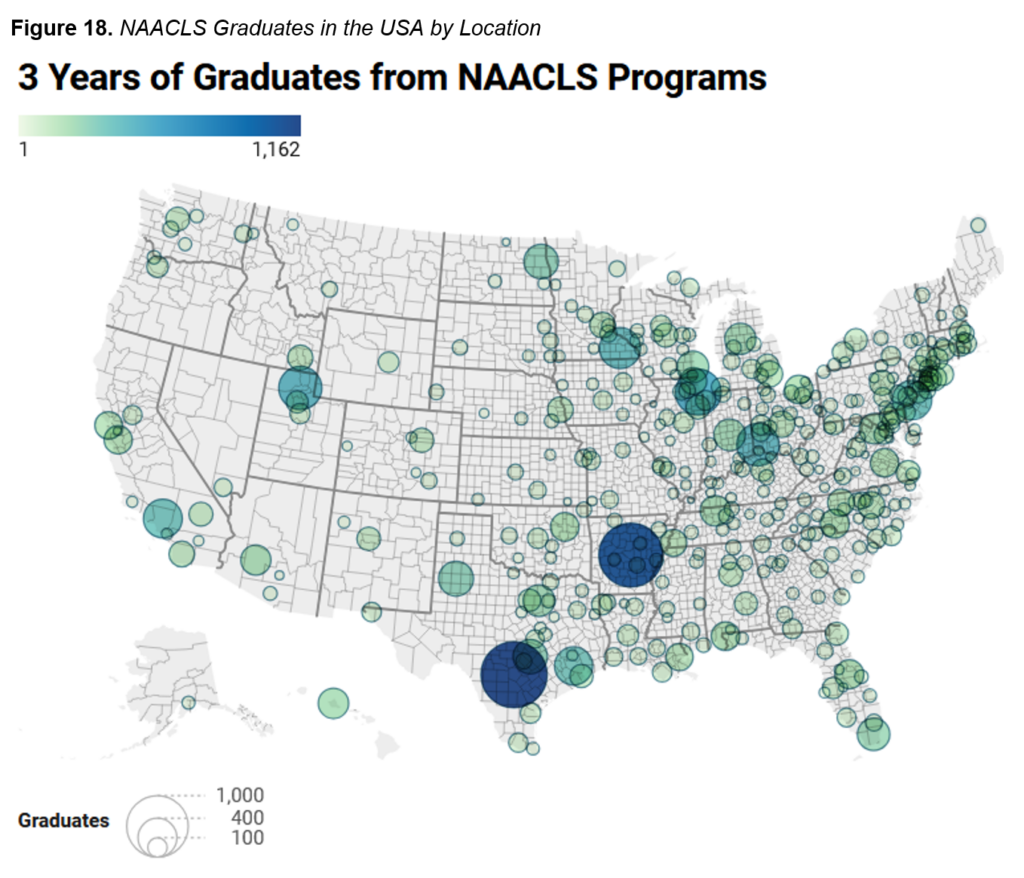
Figures 17 and 18 illustrate the geographic distribution of approximately 9,000 graduates annually from NAACLS-accredited programs across the United States by county and zip code. These visualizations highlight the nationwide reach of NAACLS-accredited programs, as well as where challenges remain. Interactive, scalable versions of Figure 17 and Figure 18 are also provided.
Categorical Information
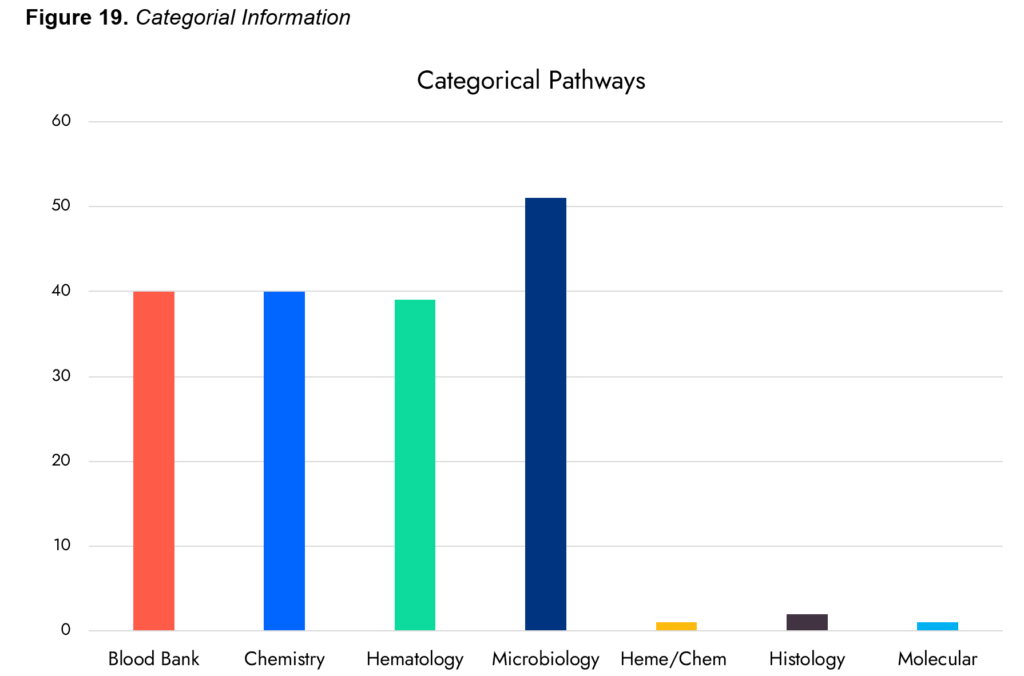
See Figure 19 for new insight into the number of programs that offer categorical educational routes through the auspices of their MLS or MLT program.
Reflections from the CEO
Data from the 2025 NAACLS Annual Survey of Programs reveal encouraging trends. Across several disciplines, both the number of accredited programs and the number of graduates increased. Most notably, total graduates exceeded 9,000 for the first time in seven years. This is a significant milestone! Yet demand for qualified laboratory professionals continues to outpace supply.
Importantly, these data also challenge the often-repeated narrative that NAACLS-accredited programs are declining. While the landscape of laboratory education has changed considerably since the 1990s, recent data show program numbers are holding steady overall, while graduation numbers continue to rise. Interest in the laboratory profession also appears to be strong, as reflected in the number of qualified applicants. These are positive indicators, but they also raise important questions about our capacity to accommodate interested students and ensure they have access to the educational and clinical experiences necessary to complete their training.
Growth, however, comes with challenges. As the demand for qualified laboratory professionals increases, educational programs are being asked to expand enrollment, develop new programs, and recruit the next generation of laboratory professionals, often with limited resources. Addressing workforce shortages requires more than increasing the number of students entering programs. It requires sustained investment in the faculty, administrative support, operating budgets, and clinical training opportunities necessary to maintain high-quality laboratory education.
One important trend for NAACLS to monitor is whether enrollment and class size increases are matched by corresponding increases in institutional support. While expanding educational capacity is essential, growth without adequate resources risks placing additional strain on educators, program administrators, and clinical affiliates who are already managing significant demands. This could also risk sending underprepared graduates into the laboratory industry. We must be mindful that the solutions we pursue to address workforce shortages do not unintentionally compromise the sustainability of the programs responsible for preparing the next generation of laboratory professionals.
NAACLS continues to collaborate with organizations such as the American Society for Clinical Pathology (ASCP), the American Society for Clinical Laboratory Science (ASCLS), the Workforce Action Alliance (WAA), and the Medical and Public Health Laboratory Workforce Coalition to advocate for investments in the laboratory workforce and the educational infrastructure that supports it. These partnerships create opportunities to strengthen workforce data, identify barriers to program expansion, and advocate for grant funding and other resources that directly support laboratory education.
NAACLS advocacy efforts also extend to federal legislation. NAACLS co-signed a letter supporting H.R.5444, the Medical Laboratory Personnel Shortage Relief Act, an initiative coordinated by ASCLS. The legislation seeks to include laboratory professionals in the National Health Service Corps, expand access to scholarships and loan repayment assistance, and authorize $25 million to support accredited laboratory education programs. This legislation remains a priority as attention turns to the next Congress in 2027.
Additionally, NAACLS is leveraging data collected through the Annual Survey of Programs beyond tracking educational trends. This data provides valuable insight into the contributions, challenges, and capacity of accredited programs and can serve as a powerful advocacy tool. Recognizing this opportunity, the NAACLS Board of Directors recently approved sharing survey data with ASCLS to support its advocacy efforts. By providing evidence of workforce needs, faculty and preceptor shortages, and limitations in educational capacity, NAACLS can help strengthen the case for increased institutional investment, government funding, and other resources necessary to support sustainable program growth.
Conclusion and next steps for the NAACLS Annual Survey of Programs
NAACLS will continue refining Annual Survey of Programs questions to capture more meaningful insights into the experiences and needs of accredited programs. The additional data visualizations in this report also highlight programs’ creativity and adaptability as they respond to changing workforce demands. NAACLS’ Standards support this flexibility by giving institutions opportunities to develop educational models suited to their unique circumstances while maintaining expectations for educational quality.
At the same time, we must recognize that growth is not occurring uniformly across all disciplines. For those experiencing declines in program or graduate numbers, we should consider what additional efforts are needed to raise awareness of the profession and its many career opportunities. How can we better showcase the vital work and expertise of laboratory professionals to prospective students, educational administrators, institutional leaders, and the broader community? How can we strengthen the visibility and value of laboratory education so that programs receive the recognition and resources they need?
The trends in this report give us much to celebrate, but they also remind us that thoughtful, sustained investment must support progress. We cannot solve the laboratory workforce shortage by continually asking educational programs to do more with less. Sustainable workforce growth requires sustainable investment in laboratory education. With meaningful data, strong partnerships, flexible accreditation standards, and continued advocacy, NAACLS plays an important role ensuring programs can grow and are positioned to thrive.
Disclaimer – This published information was developed from a survey of information submitted to NAACLS by NAACLS-accredited programs. The published information contains only historical information and does not contain any projected information. NAACLS has not verified the accuracy, completeness, or suitability of any published information, and it does not recommend, encourage, or endorse any use of the published information. NAACLS makes no warranty, guarantee, or representation whatsoever, and assumes no liability or responsibility in connection with the use or misuse of this publication.